Revista Industrial Data 25(2): 115-142 (2022)
DOI: https://doi.org/10.15381/idata.v25i2.16636
ISSN: 1560-9146 (Impreso) / ISSN: 1810-9993 (Electrónico)
Liquefied Petroleum Gas (LPG) Supply Scenarios from a System Dynamics Approach
Beatriz Juana Adaniya Higa[1]
Ricardo Rodríguez Ulloa[2]
Submitted: 08/01/2021 Accepted: 27/06/2022 Published: 31/12/2022
ABSTRACT
In this paper we analyze the problems of LPG supply in Peru, based on various factors that have a significant impact on its value chain. The complexity of the analysis requires the use of various techniques and methodologies, such as the system dynamics used in this study, which, using a proposed model, generates various hypotheses to explain the behavior patterns of the analyzed variable and to understand causal logic over time when it interacts with other variables. As a result, a model that generates possible scenarios that confirm the decrease in LPG production over time due to inaction with respect to natural gas production, and highlights the need to encourage investments in exploration efforts to further increase natural gas reserves, is proposed. The research concludes that it is necessary to establish public policies to achieve market conditions that ensure LPG supply.
Keywords: LPG production, demand, supply, scenarios, system dynamics.
INTRODUCTION
In this research, we propose a model based on the system dynamics methodology designed to show possible scenarios for the supply of liquefied petroleum gas (LPG) in Peru, considering the different factors involved in its value chain and that have a significant impact on the supply of LPG at the national level, when situations that affect any of these factors arise. This model, based on the analysis of the behavior of systems and designed specifically for LPG, is relevant because its development contributes to the understanding of the interrelationships between the behavior of the system and its structure (Campos et al., 2005); it is therefore possible to predict the behavior of each of the factors that have a significant impact on the supply of LPG over time. Through the simulation of different scenarios, authorities may be able to establish public policies to solve the problem of LPG supply shortages when the risks associated with the analyzed factors materialize.
Domestic use of LPG in Peru began in the 1950s when the International Petroleum Company, operated by ESSO (which became Compañía Peruana de Gas years later), installed the first LPG bottling plant. In 1992, following the privatization of Compañía Peruana de Gas, new provisions were established for the commercialization of LPG cylinders, which included the responsibility of the bottling plants for their maintenance. Three years later, in 1995, the first LPG gas center for vehicle use began operations (Organismo Supervisor de la Inversión en Energía y Minería [Osinergmin], 2017). As a result of the development of the LPG market and the country’s economic growth, the use of LPG increased at a rate of approximately 6% per year in the commercial and industrial sector (Aguirre et al., 2015), which made it necessary to import LPG in the first six months of 2004 because of the unsatisfied demand for this energy source.
At that time, LPG was basically produced by two oil refineries: one operated by Petróleos del Perú S.A., located in the north of the country, specifically in the city of Talara, department of Piura; and the second operated by Repsol, located in the district of Ventanilla, in the constitutional province of Callao. Likewise, the Yarinacocha Plant, operated by Aguaytía Energy, in the department of Ucayali, also produced a limited amount of LPG by fractionation of natural gas liquids (NGLs).
The start of operations of the Pisco NGL Fractionation Plant, located in the department of Ica and operated by Pluspetrol Perú Corporation, turned Peru into an exporting country. The plant uses NGL as feedstock, which is derived from condensed natural gas produced by Pluspetrol Perú Corporation in block 88, located in Camisea, Cusco, as shown in Figure 1. The natural gas produced is transported to the Malvinas separation plant where dry natural gas (DNG) and NGL are obtained. The DNG is injected into a pipeline and the NGL is transported by poly pipeline for fractionation at the Pisco Plant and produces LPG, naphtha and a middle distillate for blending (Adaniya, 2019). DNG is first compressed at the Kepashiato Compressor Plant and then at the Chiquintirca Plant (Ayacucho), from where a pipeline leaves for the Pampa Melchorita Liquefaction Plant (province of Chincha, department of Ica), where liquefied natural gas (LNG) is exported. Figure 2 shows a basic LPG production scheme from LNG.
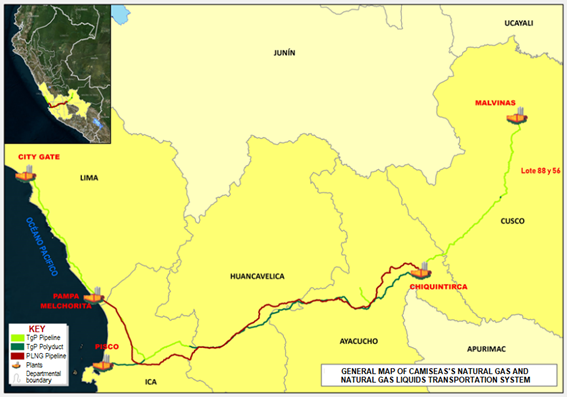
Figure 1. Map of the DNG and NGL pipeline system.
Source: Adaniya (2020).
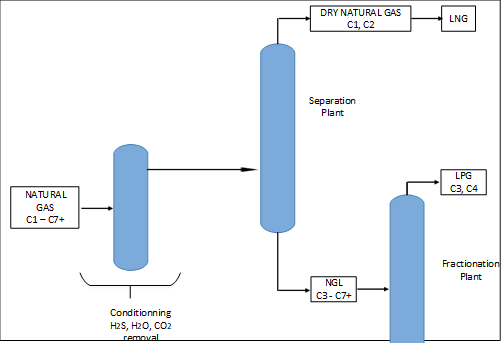
Figure 2. LPG Production.
Source: Organismo Supervisor de la Inversión en Energía y Minería (2010).
In the event of abnormal waves on the Peruvian coast, specifically on the coasts of Pisco, Chincha, Callao and Ventanilla, vessels would be prevented from taking on LPG in Pisco and unloading it at the Zeta Gas and Repsol supply plants in Ventanilla, as well as at Petroperu’s Callao terminal. It should also be mentioned that an LNG carrier would not be able to approach the Perú LNG terminal in Chincha to take on LNG for export, and therefore the liquefaction plant would have to shutdown or reduce its processing capacity due to storage limitations, impacting the production and transportation of DNG and NGL.
In this context, demand forecasting, including exports, exceeded production capacity in different periods of time. At present, Peru has lost its status as an export-oriented country due to the rapid growth in demand and the lack of new investment projects to expand LPG storage infrastructure, together with shipping terminals for tanker transportation to address emergencies due to shortages for various reasons. Installed capacity is currently insufficient, even with floating storage. Therefore, based on a cause-effect analysis of factors impacting LPG supply and the collected evidence, it is possible to generate dynamic simulation models to forecast future security of supply scenarios (Adaniya, 2020).
Objective
In this study, we proposed a model developed using the system dynamics methodology to provide possible scenarios for the supply of LPG in Peru, considering various factors that intervene in the LPG value chain and that have a significant impact on the supply of LPG throughout the country.
Theoretical Framework
It is necessary to establish the meaning of the term system before conducting a system dynamics analysis. A system can be anything that is represented by a list of variables (Ashby, 1956, as cited in Salt et al., 2016) characterized by its properties or attributes and it can also contain subsystems by defining what can be inside or outside the system (Gaines, 1979, as cited in Salt et al., 2016). The characteristics of a system, on the other hand, are based on three aspects: 1) it is known what is and what is not part of the system, 2) interactions of the system with the environment can be determined, and 3) the system accepts the “hierarchical ordering principle” (Campos et al., 2005). For the purposes of this study, we refer to un sistema como de un objeto dotado de alguna complejidad, formado por partes coordinadas, de modo que el conjunto posea una cierta unidad, que es precisamente el sistema [a system as an object endowed with some complexity, composed of coordinated parts, so that the whole possesses a certain unity, which is precisely the system] (Campos et al., 2005, p. 4). Accordingly, we analyze a unit with elements (factors) that interact with each other, affecting each other, maintaining an identity and under conditions that change constantly over time, following a complex dynamic involving multiple actors, as shown in the diagram in Figure 3 and the graphical representation of a system of greater complexity in Figure 4.
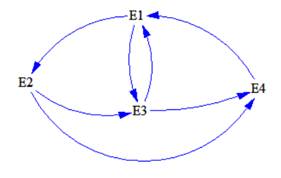
Figure 3. System Dynamics Diagram.
Source: Prepared by the authors.
![]()
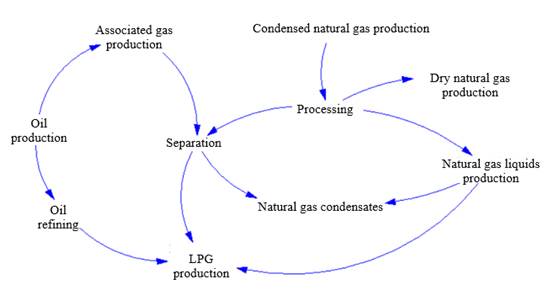
Figure 4. Graphical representation of a complex LPG-related system.
Source: Prepared by the authors.
Dynamics is another term that should be clarified, understanding that it refers to the changing character of each factor involved in the system over time (Figure 5). Therefore, system dynamics shows the way in which factors can change over time as a result of their interactions with each other.
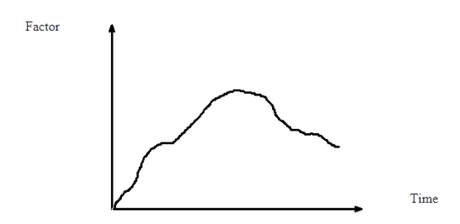
Figure 5. Graphical representation of the behavior of a factor.
Source: Prepared by the authors.
In this stage, after an experimental process, information is collected and structured to understand the causal relationships that exist between factors, as well as those of time and space. Information is then organized into a representation that will serve as a model if it adequately reflects the system's characteristics of interest and if it is sufficiently simple to use.
Campos et al. (2005) based on the definition of Granino Korn define simulation as un experimento realizado sobre un modelo [an experiment performed on a model] (p. 7). It follows that system dynamics is a method in which simulations are performed on a model that represents the factors, their interrelationships and the changes produced in space and time; this makes it possible to analyze the relationships of the factors within a system in order to explain its behavior and structure.
System dynamics was developed by Jay Forrester and explained in his works; it was originally conceived for the solution of specific problems (Forrester, 2016; Lane & Sterman, 2011). As such, Campos et al. (2005) used it to study the susceptibility, incidence and prevalence of a population to a given disease for three different cases and also developed a hydraulic analogy for each case (Campos et al., 2005).
Ibarra and Redondo (2015) presented system dynamics as a useful tool for environmental education in engineering. Cuervo et al. (2013) developed simulations that allow evaluating the quality of the transportation service within the complexity of a social system. In system dynamics, different situations are conceived as a result of a series of causal interactions between the attributes that describe them, thus constructing a series of systemic expressions with arrows and points, creating cause-effect diagrams that show various hypotheses proposed by each researcher, from which the system can be analyzed to assess different forms of intervention in a decision-making situation (Aracil, 1995; Aracil & Gordillo, 1997).
Ibarra and Redondo (2015) also mention that system dynamics was used at the end of the 1960s in the study entitled Limits to Growth, based on the results of which the first report that showed forecasts of population, resource availability and environmental pollution on the planet was published. The model has contributed to the understanding of the methodology (Aracil & Gordillo, 1997). In this regard, Boloña (1973) provides specific comments and a summary of the five (5) simulation scenarios run by the Massachusetts Institute of Technology at the request of the Club of Rome, based on dynamic systems, to model world trends in five areas: food production, industrialization, depletion of natural resources and environmental pollution, using fixed or increasing trends at different rates established under different criteria of some natural factors.
One conclusion of the analysis carried out states that the Earth will reach the limits of its growth in this century if the current trend of world population increase, industrialization, environmental pollution and food production persists, inevitably leading to the depletion of resources. Therefore, a sudden and uncontrollable decrease in population and industrial capacity is likely to occur (Meadows et al., 1972). A decrease in the rate of extraction of non-renewable resources will also be observed as the exploitation of these resources declines, causing in turn a decrease in world industrial and food production, with a subsequent reduction in the standard of living for the human and animal populations. The analysis of this situation is similar to that of the LPG supply problem at each stage of its value chain.
Chyong et al. (2009) developed a system dynamics model for long-term energy policy analysis. They found that supply-side policy management alone cannot defer discovery, production and consumption peak. They also found that the dynamics of the main variables such as exploration, production and consumption are sensitive to initial demand conditions. They observed the behavior of the price of natural gas with respect to demand growth and the influence of tax policy with respect to increased exploration and production of natural gas, and determined that, by lowering taxes, these activities would be boosted, thus increasing consumption rates. Their findings, however, revealed that there was no overall net impact on production and consumption in the long-term. The effect of reduced exploration costs balances the low-tax policy; it also causes costs and prices to rise more than it reduces the consumption rate. They conclude that technological advances in natural gas exploration and production may delay exploration, production and consumption peak, implying that lower costs suppress the dynamics of the price pattern in the long run.
For the purpose of analyzing the role of renewable energy policies on energy dependence in Finland, Aslani et al. (2014) studied the role of diversification on energy supply dependence and security using a system dynamics model with a special focus on the role of renewable energy resources. They also aimed to bridge, in part, the research gap in modeling using system dynamics in energy security research. Their approach was based on causal loop diagrams and a system dynamics model to evaluate three different Finnish scenarios of renewable energy policies for 2020. The analysis showed that, despite the 7% growth in electricity/heat consumption by 2020 in Finland, the dependence on imported sources would decrease by 1% to 7% depending on the scenarios selected. The goodness of fit of this model could be verified with data for 2021. According to the authors, the proposed model would not only help decision makers to test scenarios related to renewable energy policies, but could also be implemented by other countries (Aslani et al., 2014).
All these studies support the application of system dynamics modeling to the study of LPG shortages, which can lead to the establishment of public policies to ensure LPG supply. For the analysis of the problem, the soft system dynamics methodology (SSDM) is followed, according to the guidelines of the soft systems methodology (SSM) of Peter Checkland combined with system dynamics (Rodriguez & Paucar, 2005). Such methodology allows the identification of the variables involved, since each individual has their own perception and interpretation of the world and will therefore also have their own perception and interpretation of a particular problematic situation.
Martínez and Ríos (2007) have also applied this methodology, combined with the unified modeling language (UML), to propose the design of an executive information system for managers to provide them with basic information, deliver statistics on variables of interest and simplify decision making. It has also been a useful tool to implement communication systems from a digital perspective. In this regard, in the research by Murillo et al. (2019) the existing knowledge was integrated and organized with an in-depth study of the principles and processes of a communication system based on the transdisciplinary nature of knowledge. This was achieved by using metodologías cibernéticas de segundo orden y sistémicas como la metodología de sistemas blandos [second-order cybernetics and systemic methodologies such as the soft systems methodology], which allows differentiating los procesos epistémicos y ontológicos del proceso de investigación-acción a través de la resolución de situaciones-problema [the epistemic and ontological processes of the action-research process through the resolution of problem-situations] (Murillo et al., 2019, p. 1). Their proposal has contributed to develop nuevas etapas para el estudio de la comunicación como un sistema cada vez más integrado, de mayor alcance y con más aplicaciones en el mundo real [new stages for the study of communication as a system that is becoming more comprehensive, of broader scope and with more applications in the real world] (Murillo et al., 2019, p. 1).
METHODOLOGY
System dynamics is a methodology that helps to formulate different hypotheses to explain through causal loops (Figure 7) the behavior patterns that a variable (factor) might have when interacting with other variables (factors), in order to understand the causal logic of its behavior over time. It is therefore important to emphasize that in system dynamics different situations are being simulated when scenarios change, changing the formulas used and the time frame.
It should be noted that this methodology is based on four fundamental definitions. First, state variables or stock that may reflect the state of the system at a particular time due to an accumulation of resources over time or as a result of variations between inflows and outflows. Second, a second definition corresponds to the flow variables (flows) with which fluid or energy fluxes are observed between two stock variables. The two remaining definitions are equations, the first corresponds to the rate equations that represent the accumulated level of a variable and its rate of change in a given time interval; whereas the flow equations represent the rates of change of stock variables and define the behavior of the system within the model (Ramoni & Orlandoni, 2022).
SSDM methodology was used for the analysis of LPG supply problems in Peru. It proved instrumental in properly defining the problem and the conflict situations or critical aspects that arise in the supply of LPG, as well as in identifying the restrictions and alternative solutions, based on the use of SSDM in the study of natural gas problems (Rodríguez et al., 2015). The above contributed to the identification of the various factors and variables, both qualitative and quantitative, that must be considered in this complex issue.
On the basis of system dynamics, this section initially describes the system dynamics methodology (SDM) and its application to various LPG supply scenarios. Figure 6 shows the five (5) main steps to build a system dynamics model, which configure an iterative process.
Step 1: Problem Articulation. The dynamic problem, namely, the variable of interest is determined and its dynamic behavior is analyzed over time. A dynamic approach helps to recognize the need to examine the variable of interest and to answer why it is a problem from the perspective of at least one customer. The behavior of the problem variable is deduced from statistical information, considering a significant period of time, which allows understanding its possible behavior pattern. In this research, the variable of interest is “NGL processing”, given that LPG will be obtained from it and, therefore, LPG supply will be guaranteed.
Step 2: Dynamic Hypothesis. Several hypotheses are formulated at this stage to explain, using causal loops, the behavior patterns that the variable under study might have when interacting with other variables, in order to understand the causal logic of its behavior over time. The formulation of the various hypotheses occurs during the simulation process each time the proposed dynamic model is run, selecting different scenarios that give rise to dynamic hypotheses.
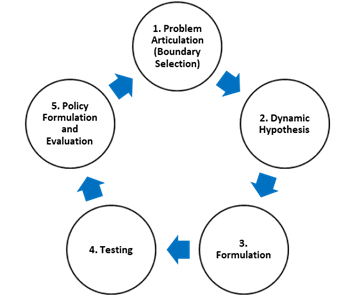
Figure 6. System Dynamics Methodology (SDM).
Source: Prepared by the authors.
At any stage, the results may generate feedback that leads to revisions in any previous stage.
Every dynamic hypothesis generated in each simulation or model run has a different causality and the one that best explains the dynamic behavior of the problem defined in Step 1 will be chosen.
Step 3: Formulation. After choosing the causal diagram that explains the dynamics of the problem, a Forrester diagram is formulated and elaborated, in other words, the causal diagram is converted into stock and flow diagrams. Forrester diagrams are interpreted by the computer to model the variables and their causal relationships over time. Data will also be entered for each variable in order to run the model.
Step 4: Testing. It is possible to model the problematic behavior of the analyzed variable with Forrester diagrams using ad-hoc software and the necessary data. Several sensitivity analyses of the model can then be performed to understand the extent of its behavior.
Step 5: Policy Formulation and Evaluation. After the spectrum of possible behaviors of the problem variable has been identified, various changes in the structure of the model are tested. These changes should be possible to implement in the real world and allow changing the course of action of the problem variable to achieve a behavior compatible with the expectations of at least one client.
These structural changes constitute the formulation of possible policies that can be implemented to improve the encountered scenario. Such policies are subsequently evaluated to determine which of them is the most suitable for implementation in order to improve the future performance of the variable. Upon evaluating the range of possible policies to be implemented, the most suitable one is selected and implemented, thus concluding the use of SDM.
RESULTS
Ensuring the supply of LPG at the national level is a complex problem that requires the use of different techniques and methodologies of analysis to solve it. System dynamics allows the analysis to be carried out generating changes in the variables from initial conditions, and conducting a sensitivity analysis on said changes.
The analysis of the LPG supply problem using DSM is based on a cause-effect diagram, shown in Figure 7, which considers the key elements or factors of the system, as well as the relationships between them. In other words, hypotheses were identified and generated regarding the possible causal relationships between these factors, representing the type of influence that one element exerts on another. For instance, a positive sign means that a change in one element will produce a change in the same direction, and a negative sign indicates that the effect will be the opposite. As seen in Figure 7, for example, there is a positive relationship when the wet natural gas (WNG) separation rate increases, as it leads to an increase in DNG transport, or when the WNG separation rate decreases, as it leads to a decrease in DNG transport. On the other hand, there is a negative relationship when abnormal waves occurrence increases, as it leads to lower LPG supply by maritime transport and, when abnormal waves occurrence decreases, it allows for a higher LPG supply by maritime transport.
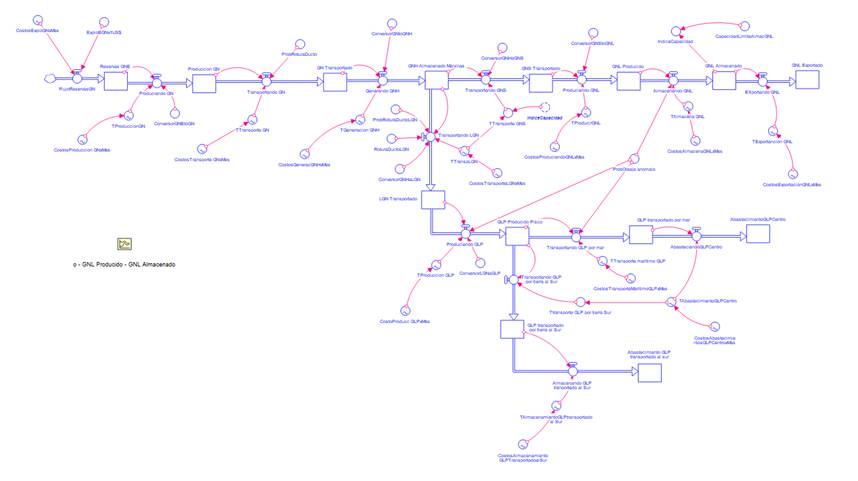
The dynamic model, shown in Figure 8, was developed on the basis of the causal diagram, which considered that there is a stronger relationship between LPG production and the natural gas value chain, in view of the low percentage of LPG produced from petroleum refining (Adaniya, 2019).
It is evident from the above that the application of SDM to the analysis of LPG supply in Peru raises an important question that attempts to provide an answer or solution to the scientific problem, which is related to the question on what is the dynamic structure that explains the real anomalous behavior of LPG supply. This paper attempts to demonstrate that a model designed based on the concepts of system dynamics allows predicting long-term certain behavior to ensure the sustainability of LPG supply at the national level. The dynamic model generates scenarios and forecasts that support decision-making on alternatives that guarantee LPG supply. This analysis differs from the scientific perspective of demonstrating facts since, in this case, situations are being simulated, making it different.
System dynamics takes into account, within a given simulation time period, the rates that connect one stage of the value chain to the next, as well as random factors that affect them, such as risks that may materialize during the transportation of natural gas (pipeline rupture) or port closures that prevent the loading or unloading of carriers, which affect the storage, transportation and distribution of LPG. The dynamics of changes in the various stages of the LPG value chain make it possible to perform a sensitivity analysis, by changing the value of a particular variable, to evaluate the scenarios that might arise as a result. In the research, the unit of time was the month and the simulation was projected for a 10-year period (120 months).
Historical data from the period 2000-2016 was used for this modeling, which included uniform figures for natural gas reserves and production as well as WNG in storage, DNG transported, domestic market, LNG produced, LNG in storage, LNG exported, NGL transported, LPG produced in Pisco, LPG transported by land to the south, LPG supply to the south, LPG transported by sea, and LPG supply to the center (Adaniya, 2020). The barrel was chosen as the unit because of its common use in the hydrocarbon industry. Also, rates are used with units of barrels/month and dimensionless parameters, as appropriate. Exploration investments were not considered. Financial aspects of the value chain are left for further research.
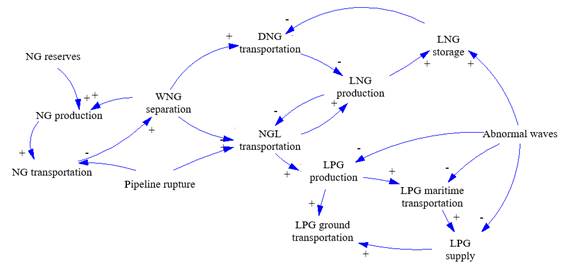
Figure 7. Cause-effect type relationships between factors that can cause LPG shortages.
Source: Prepared by the authors.
DISCUSSION
Figure 8 illustrates the application of a system dynamics model for LPG production. For each simulation run, a description of the behavior of each variable analyzed over time is obtained. Namely, each variable of the model, expressed in terms of a value, a rate or a dimensionless parameter, is part of an algorithm that subject to variations at will generates new scenarios that must interpreted. Therefore, each simulation run is an experiment conducted on the basis of a dynamic model that represents the factors, their interrelationships and the changes produced in space and time allowing to evaluate the relationships between the factors within a system that can explain their behavior and structure.
Figure 9 shows the behavior of three of the state variables simulated in Adaniya’s research (2020). The WNG stored in Malvinas variable corresponds to the natural gas extracted from the wells and then processed and separated at the Malvinas Plant, from which three flows are produced: one of DNG for distribution in Lima, the flow of non-demanded DNG that is reinjected to the well, and the flow of NGL that is transported to the fractionation plant in Pisco for LPG production. Figure 9 shows that the processing of WNG stored in Malvinas (curve 1) produces NGL transported (curve 2) and, consequently, LPG produced in Pisco is generated (curve 3).
Using 2019 as the starting point for the simulation, variable WNG stored in Malvinas shows a downward trajectory curve indicating that, without action on natural gas production, NGL production and LPG production will decrease over a period of approximately 20 months, within a 30-month analysis interval. Changing the scenario will vary the model, thereby providing new considerations for decision making; it is also possible to change the formulas used to obtain greater precision or detail.
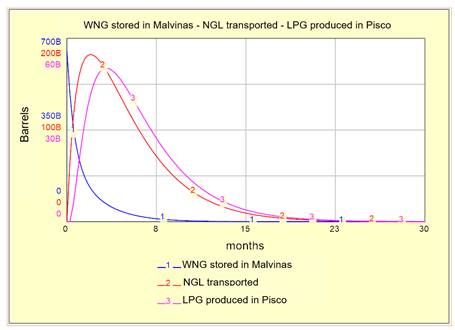
Figure 9. Graph showing the time variation of variables WNG stored in Malvinas - NGL transported - LPG produced in Pisco. Simulation using software Stella Architec 1.4.
Source: Taken from Adaniya (2019, p. 163).
A second exercise, once again using 2019 as the starting point for the simulation, shows the behavior of four variables as shown in Figure 10. It shows the variation of the transported volumes of DNG, and LNG produced, stored and exported in an interval of 120 months. According to this scenario, even though the volume of DNG transported decreases in month 105, due to the capacity of the Perú LNG liquefaction plant to produce and store LNG, the export of this product continued to increase until month 120. Any interested reader can vary the data and formulas in Table 37 of Adaniya (see Adaniya, 2020, p. 184) to create new hypotheses and, using the model, can analyze new different scenarios, even with a different time period than the one analyzed in this study.
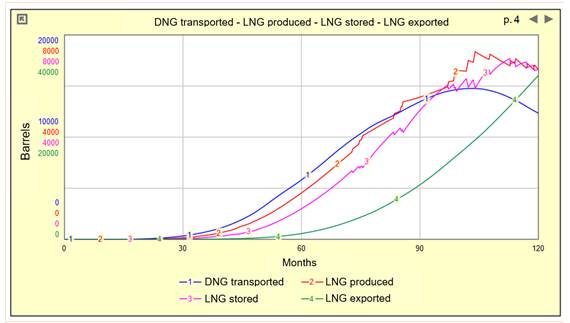
Figure 10. Graph showing the time variation of variables WNG stored in Malvinas - NGL transported - LPG produced in Pisco. Simulation using software Stella Architec software 1.4.
Source: Taken from Adaniya (2020, p. 185).
As stated by Ramoni and Orlandoni (2022)
Los modelos son estructuras teóricas simplificadas de la realidad que permiten entender el funcionamiento de los sistemas que representan, así como manipular, simular y optimizar las variables de interés con el fin de explicar su estructura interna y su comportamiento dinámico [Models are simplified theoretical structures of reality used to understand the functioning of the systems they represent, as well as to manipulate, simulate and optimize the variables of interest in order to explain their internal structure and dynamic behavior]. (p. 129)
As such, this approach makes it possible to understand and explain to some extent the behavior of a variable related to LPG, at any stage of its value chain, within a simulation process, providing a way to test relevant hypotheses through different runs that respond to specific scenarios.