Revista Industrial Data 24(2): 273-292 (2021)
DOI: https://doi.org/10.15381/idata.v24i2.20736
ISSN: 1560-9146 (Impreso) / ISSN: 1810-9993 (Electrónico)
Recibido: 05/07/2021
Aceptado: 01/11/2021
Publicado: 31/12/2021
Factores críticos para la adopción de las TIC en micro y pequeñas empresas industriales
Edgar Fernando Vasquez Reyes[1]
RESUMEN
Las micro y pequeñas empresas emplean aproximadamente al 60% de la población económicamente activa (PEA) ocupada en nuestro país, pero solo el 15% de ellas tiene acceso a las tecnologías de la información y la comunicación (TIC). Por ese motivo se percibe que no comprenden estas herramientas tecnológicas, no les dan el valor correspondiente ni la importancia debida y, como consecuencia de ello, son lentas en la adopción y uso de las TIC. La presente investigación de tipo no experimental busca evidencia de la relación entre factores críticos y la adopción de las tecnologías de la información en este tipo de empresas. Para ello se realiza una encuesta a 179 empresarios en Lima Metropolitana. Luego de la evaluación y análisis de los datos obtenidos, se demuestra que 11 factores tienen una correlación positiva para la adopción de tecnologías de la información y 3 se rechazan porque el nivel de significancia obtenido es mayor a 0.05. Así, se genera un nuevo modelo de adopción de tecnologías de la información para este tipo de empresas basado en los 11 factores aceptados.
Palabras clave: mype, TIC, TOE, adopción de tecnologías, industria manufacturera.
INTRODUCCIÓN
En la actualidad, todas las organizaciones (grandes y pequeñas) se enfrentan a situaciones relevantes: nuevas tendencias de gestión, uso de herramientas tecnológicas, software más avanzado, multicanalidad y omnicanalidad, etc. Sin embargo, se observa que, en particular, las mypes no aceptan y no utilizan las herramientas TIC, lo que les impide aprovechar las oportunidades de crecimiento potencial. En su Encuesta Económica Anual 2018, El Instituto Nacional de Estadística e Informática evidencia que 97.7% de la industria manufacturera usan computadoras para su trabajo diario. El 91.8% de las MYPE usa internet. Adicionalmente el 59.2% de las empresas usan el correo electrónico y chat como principal herramienta tecnológica para comunicarse con su personal, clientes y proveedores (INEI, 2020).
Para conocer esta realidad en el Perú, es importante realizar más investigaciones que identifiquen los factores críticos o determinantes que limitan la adopción de las TIC en las mypes industriales de Lima Metropolitana. En el último quinquenio, un sin fin de investigaciones relacionadas con la adopción de tecnologías de la información han hecho referencia a los beneficios de las TIC y una variedad de factores críticos que influyen en su adopción.
En el 2016, Cuevas-Vargas, Estrada, y Larios-Gómez (2016), argumentaron que las TIC contribuyen a mejorar las economías, generar crecimiento y eficiencia, y facilitar la transformación digital a través de las mejoras de procesos y automatismo. Hassan (2017) estudió el efecto de los factores organizativos en la adopción de cloud computing (computación en la nube) entre las pymes del sector de servicios en Malasia. Los resultados obtenidos en su estudio indicaron que el factor crítico recursos de TI tuvo una influencia significativa en la adopción de cloud computing; sin embargo, los factores críticos como el apoyo de la alta dirección y el conocimiento de los empleados no fueron significativos.
Por su parte, Singh, Luthra, Mangla, y Uniyal (2019) realizaron un estudio de las pymes del sector alimentario, en el cual propusieron 17 factores críticos para la adopción de tecnologías. En su estudio indicaron que las organizaciones en el sector de los alimentos estaban tratando de poner en uso las TIC para reestructurar las actividades de la cadena de valor con el objetivo de reducir el desperdicio, lograr una mejor utilización de los recursos y proteger el medio ambiente.
Chau y Deng (2018) desarrollaron un modelo conceptual que les permite a los investigadores probar y comprender empíricamente los factores críticos para la adopción del comercio móvil en las pymes vietnamitas. Este modelo permite evaluar los siguientes factores críticos: beneficios percibidos, compatibilidad percibida, complejidad percibida, seguridad percibida, costos percibidos, conocimiento de TI de los empleados, preparación organizacional, orientación estratégica, soporte de la alta dirección, presión competitiva, presión del cliente y apoyo del gobierno. En Vietnam, los dispositivos móviles son el medio más popular de conexión a Internet, dado que representan el 98% de los dispositivos utilizados para acceder a Internet. Sin embargo, la lenta adopción del comercio móvil en las pymes vietnamitas puede atribuirse a muchos desafíos. Para empezar, las pymes vietnamitas comparten las mismas barreras para la adopción de nuevas tecnologías en general y del comercio móvil en particular que las pymes de otros países en desarrollo.
En la actualidad, muchas de las micro y pequeñas empresas se han visto forzadas a efectuar el cierre de sus operaciones como resultado de la pandemia del COVID-19, dado que no cuentan con tecnología para operar online. Las redes sociales se han visto inundadas con ofertas de bienes y servicios con un fuerte componente de manejo digital. Las micro y pequeñas empresas se han visto obligadas a adoptar esta forma de atención de clientes que es nueva para ellas, pues antes no tenían el interés de hacerlo. Esta investigación busca identificar los factores críticos que impedían que adoptaran dicha forma de trabajo.
Para reforzar ese conocimiento, en este trabajo de investigación centrado en las micro y pequeñas empresas, se plantean dos objetivos: proponer un modelo conceptual coherente que incluya los factores críticos más relevantes para el éxito de la adopción de las TIC y probar el modelo propuesto recopilando datos cuantitativos con base en sus atributos críticos.
Además, se plantea también la siguiente hipótesis general: Existe relación entre el modelo propuesto y la adopción de las TIC en las mypes industriales en Lima Metropolitana.
Este estudio presenta algunas limitaciones, dado que se centra en la etapa de desarrollo y revisión del modelo conceptual, por lo tanto, será necesario realizar un estudio experimental más adelante para probar la propuesta y confirmar los resultados.
Debido a las limitaciones de la investigación sobre la adopción de tecnologías de información en las mypes, los factores críticos específicos en el modelo propuesto para la adopción de las TIC se identificaron a través de una investigación cualitativa. La población del estudio estuvo conformada por las mypes que no habían adoptado las TIC localizadas en la Zona 4, distrito de La Victoria de Lima-Metropolitana, de acuerdo con la clasificación APEIM NSE 2020. Las diferencias en su percepción sobre los factores críticos pueden crear el sesgo para los resultados empíricos. Finalmente, el marco propuesto se desarrolló para el caso de las mypes, localizadas en Lima Metropolitana, que aún no adoptan un sistema de información.
Se propone un modelo integrador que permite resumir las principales contribuciones de los estudios previos, en donde se han identificado los factores críticos para la adopción de las TIC en las mypes industriales de Lima Metropolitana. La base teórica de la adopción de tecnología a nivel de organización describe cómo el contexto de la empresa influye en la adopción e implementación de innovaciones tecnológicas.
Numerosos estudios empíricos han analizado los atributos críticos de éxito para la adopción de las TIC. En este estudio, se realizó una exhaustiva revisión de la literatura relevante en un esfuerzo por obtener una visión completa del tema y, por consiguiente, definir mejor su alcance. De la literatura revisada se desglosan los atributos presentados en la Tabla 1.
Tabla 1. Atributos críticos identificados.
|
Factor |
Atributo CE |
Referencia literaria |
|
Tecnológico |
Beneficios percibidos |
(Oliveira y Martins, 2010), (Chau y Deng, 2018) |
|
Complejidad percibida |
(Rogers y Shoemaker, 1971), (Thong, 1999), (Chau y Deng, 2018) |
|
|
Seguridad percibida |
(Sulaiman, 2000) , |
|
|
Costo percibido |
(Thong, 1999), ( Chang, Hung, Yen, y Lee, 2010), (Tornatzky y Fleischer, 1990) |
|
|
Organizacional |
Preparación tecnológica |
(Rahayu y Day, 2015), (Zhu, Kraemer, y Xu, 2006), |
|
Experiencia tecnológica previa |
(Raut, Gardas, Jha, y Priyadarshinee, 2017) |
|
|
La resistencia al cambio |
(Luiz, Costa, Dos Santos, y Tsutsumi, 2020) |
|
|
La cultura organizacional |
(Chiavenato, 2002) , (Gibson, Ivancevich, Donelly, y Konospake, 2006) |
|
|
Entorno o Ambiental |
Presión de los proveedores |
(Rahayu y Day, 2015), (Duan, Deng, y Corbitt, 2012) |
|
Presión de los competidores |
(Zhu y Kenneth, 2005) |
|
|
Apoyo gubernamental |
(Rauta, Gardas, Jha, y Priyadarshinee, 2017), (Alrawabdeh, 2014) |
|
|
Individual |
Compromiso de la alta gerencia |
(Thong, 1999), (Rauta, Gardas, Jha, y Priyadarshinee, 2017), (Gangwar, Date, Ramaswamy, 2015) |
|
Actitudes de los gerentes hacia la adopción de TI |
(Chang, Hung, Yen, y Lee, 2010), (Chen, Windasari, y Pai, 2013) |
|
|
Experiencia TIC de la gerencia |
(Rahayu y Day, 2015), (Morteza, Arias-Aranda, y Benitez-Amado, 2011) |
Fuente: Elaboración propia.
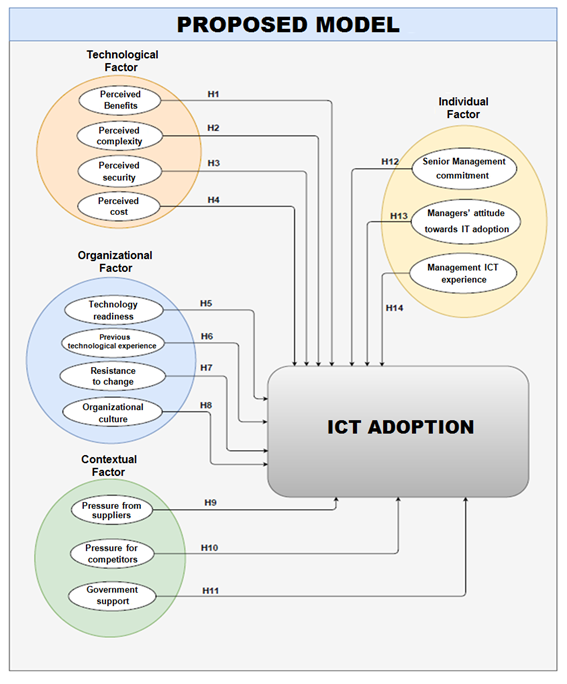
A continuación, el modelo propuesto se muestra en la Figura 1.
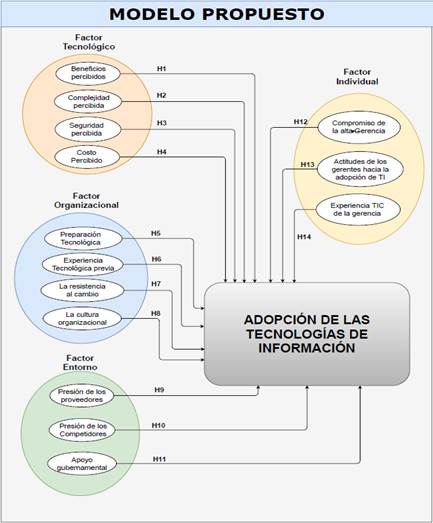
Figura 1. Modelo propuesto.
Fuente: Adaptado de Tornatzky y Fleischer (1990).
El estudio contribuye a fortalecer el conocimiento de los factores críticos para la adopción de las TIC en las mypes y ayuda a los gerentes a mejorar la evaluación de la condición de la empresa y los posibles factores críticos que conducirían a la adopción exitosa de las TIC en sus empresas.
METODOLOGÍA
De acuerdo a la tipología de Hernández (2014), este estudio es de tipo descriptivo - correlacional. Es descriptivo porque se especifican las propiedades y características de personas y se las somete a análisis. Es correlacional porque se calcula el grado de relación que existe entre dos o más variables. Se aplica el diseño no experimental, transeccional, correlacionales-causales, dado que no se modifican deliberadamente las variables, solo se visualizan y analizan los sucesos en su ambiente natural para describir las variables evaluadas en términos correlacionales.
La unidad de análisis de la investigación está constituida por los propietarios, gerentes, jefes o empleados con experiencia laboral en una micro, pequeña o mediana empresa industrial en Lima Metropolitana.
El instrumento de recolección de datos es la encuesta y los resultados serán procesados con el programa estadístico SPSS versión 25.0 para Windows y Excel 2019 para procesar las tablas.
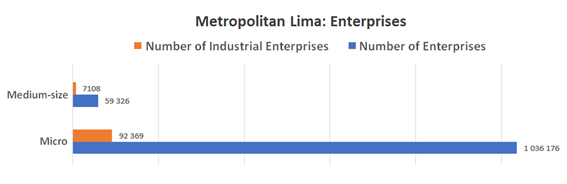
En la Figura 2, se observa la población polinomial. Se muestra la cantidad de empresas industriales en Lima Metropolitana que asciende a un total de 99 477, de las cuales 92 369 son micro empresas y 7 108 son medianas empresas.
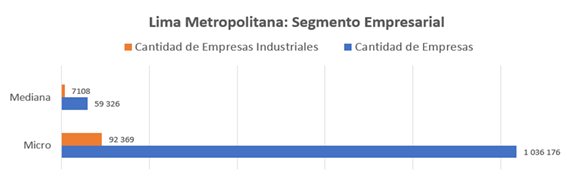
Figura 2. Población del estudio.
Fuente: Elaboración propia.
Sobre la base de las 99 477 empresas identificadas, se aplicó la siguiente segmentación tomando como referencia a las empresas industriales que pertenecen a la Zona 4, distrito de La Victoria, de acuerdo a la clasificación APEIM NSE 2020 y que no habían adoptado las TIC. La población estuvo conformada por 186 mypes. La desviación estándar (σ) se calculó con una encuesta piloto a un grupo de 67 encuestados que arrojó como resultado más pesimista 1.71, un margen de error de 5% y un nivel de confianza de 95%.
En la Tabla 2, se presenta el cuadro para el cálculo de la muestra:
Tabla 2. Parámetros para el cálculo de muestra.
|
Descripción |
Variable |
Valor |
|
Tamaño de la población |
N |
186 |
|
Nivel de confianza |
Z |
1.96 |
|
Desviación estándar |
σ |
1.71 |
|
Error de estimación |
e |
0.05 |
Fuente: Elaboración propia.
Fórmula para calcular el tamaño de la muestra:
![]()
La muestra estuvo compuesta por 179 individuos.
La fiabilidad del instrumento se comprobó mediante la aplicación de una encuesta piloto. Inicialmente, se identificaron 67 preguntas para el instrumento a utilizar y se evaluaron indicadores estadísticos que permitieran validar y ajustar el instrumento final. Con estas preguntas se realizó la encuesta inicial en marzo de 2020 de forma virtual. En un principio, se pensó realizar la encuesta de forma mixta, es decir, física y virtual, en los principales centros de producción industrial de Lima Metropolitana que no habían adoptado las TIC y pertenecen a la Zona 4 – distrito de la Victoria. Para ello, se conformó un equipo de 10 personas, incluido el investigador; sin embargo, la encuesta de forma física tuvo que ser descartada, debido a la pandemia que azota el planeta en el año 2020.
En la encuesta piloto, de los 36 cuestionarios completados, solo 28 fueron válidos. Luego se calculó el Alfa de Cronbach y se eliminaron 13 preguntas porque no alcanzaron el valor esperado. Finalmente, se identificaron 54 preguntas para evaluar la adopción de tecnologías de la información en las mypes industriales de Lima Metropolitana y, adicionalmente, 8 preguntas generales.
En la Tabla 3, se muestran los resultados de confiabilidad para el instrumento obtenidos mediante el coeficiente alfa de Cronbach.
Tabla 3. Fiabilidad del documento.
|
Alfa de Cronbach inicial |
Alfa de Cronbach final |
N.° de ítems iniciales |
N.° de ítems depurados |
N.° de ítems finales |
|
|
V0 |
0.726 |
0.914 |
8 |
2 |
6 |
|
0.900 |
0.900 |
8 |
|
8 |
|
|
V2 |
0.592 |
0.899 |
7 |
4 |
3 |
|
V3 |
0.906 |
0.906 |
3 |
|
3 |
|
V4 |
0.716 |
0.756 |
4 |
1 |
3 |
|
V5 |
0.919 |
0.919 |
3 |
|
3 |
|
V6 |
0.504 |
0.880 |
6 |
3 |
3 |
|
V7 |
0.796 |
0.796 |
3 |
|
3 |
|
V8 |
0.824 |
0.824 |
3 |
|
3 |
|
V9 |
0.660 |
0.660 |
3 |
|
3 |
|
V10 |
0.681 |
0.737 |
5 |
2 |
3 |
|
V11 |
0.825 |
0.825 |
3 |
|
3 |
|
V12 |
0.853 |
0.853 |
3 |
|
3 |
|
V13 |
0.889 |
0.889 |
4 |
|
4 |
|
V14 |
0.751 |
0.801 |
4 |
1 |
3 |
|
TOTAL |
|
|
67 |
13 |
54 |
Fuente: Elaboración propia.
Se consideraron 54 preguntas para el instrumento de encuesta final tras depurar 13 preguntas del cuestionario inicial; los ítems finales obtuvieron el indicador de Alpha de Cronbach esperado.
Variables identificadas
Independiente: Factores críticos de éxito
Dependiente: Adopción de las Tecnologías de la Información en las mypes industriales
RESULTADOS
Encuesta final
La encuesta final se realizó con 62 ítems, 8 ítems de control y 54 ítems para la investigación, estas últimas divididas en 14 atributos críticos o constructos según el modelo propuesto para la investigación, se obtuvieron 190 encuestas validas de 210 realizadas. A las personas responsables dentro de la empresa se les envió vía comunicación electrónica (email, WhatsApp, otro) el link de la encuesta con una guía de llenado. Los resultados serán procesados con el programa estadístico SPSS versión 25.0 para Windows y Excel 2019 para generar las tablas.
Tabla 4. Fiabilidad de la herramienta final.
|
Atributo CE |
Preguntas de control |
Alfa de |
Ítems |
|
V0 |
Sobre la adopción de tecnologías de la información |
0.891 |
6 |
|
V1 |
Beneficios percibidos |
0.943 |
8 |
|
V2 |
Complejidad percibida |
0.882 |
3 |
|
V3 |
Seguridad percibida |
0.908 |
3 |
|
V4 |
Costo percibido |
0.914 |
3 |
|
V5 |
Preparación tecnológica |
0.839 |
3 |
|
V6 |
Experiencia tecnológica previa |
0.860 |
3 |
|
V7 |
Resistencia al cambio |
0.995 |
3 |
|
V8 |
Cultura organizacional |
0.866 |
3 |
|
V9 |
Presión de los proveedores |
0.841 |
3 |
|
V10 |
Presión de los competidores |
0.814 |
3 |
|
V11 |
Apoyo gubernamental |
0.857 |
3 |
|
V12 |
Compromiso de la alta gerencia |
0.988 |
3 |
|
V13 |
Actitudes de los gerentes hacia la adopción de TIC |
0.854 |
4 |
|
V14 |
Experiencia TIC de la gerencia |
0.832 |
3 |
|
V1-14 |
|
0.961 |
54 |
Fuente: Elaboración propia.
Tomando en cuenta que el cuestionario cuenta con 54 ítems y 14 constructos (atributos críticos), fue necesario someter cada constructo a un análisis factorial exploratorio para determinar su adecuada formación. Esto se observa en la Tabla 5.
Tabla 5. Matriz de componente rotado.
|
Atributo CE |
Descripción de la variable |
Ítems |
Correlación de ítems |
|||
|
1(T) |
2(I) |
3(E) |
4(O) |
|||
|
V9 |
Presión de los proveedores |
3 |
0.973 |
|||
|
V8 |
La cultura organizacional |
3 |
0.972 |
|||
|
V3 |
Seguridad percibida |
3 |
0.967 |
|||
|
V4 |
Costo percibido |
3 |
0.965 |
|||
|
V2 |
Complejidad percibida |
3 |
0.956 |
|||
|
V1 |
Beneficios percibidos |
8 |
0.667 |
|||
|
V13 |
Actitudes de los gerentes hacia la adopción de TIC |
4 |
0.845 |
|||
|
V12 |
Compromiso de la alta gerencia |
3 |
0.752 |
|||
|
V11 |
Apoyo gubernamental |
3 |
0.694 |
|||
|
V5 |
Preparación tecnológica del personal |
3 |
0.587 |
|||
|
V10 |
Presión de los competidores |
3 |
0.860 |
|||
|
V6 |
Experiencia tecnológica previa |
3 |
0.798 |
|||
|
V7 |
La resistencia al cambio |
3 |
0.853 |
|||
|
V14 |
Experiencia TIC de la gerencia |
3 |
0.740 |
|||
Método de extracción: análisis de componentes principales.
Método de rotación: Varimax con normalización Kaiser.
Fuente: Elaboración propia.
Como se observa en la Tabla 5, tras realizar el análisis factorial de los constructos se determina que son pertinentes; además, con base en el modelo original, es posible crear grupos de constructos más homogéneos según su correlación e interdependencia.
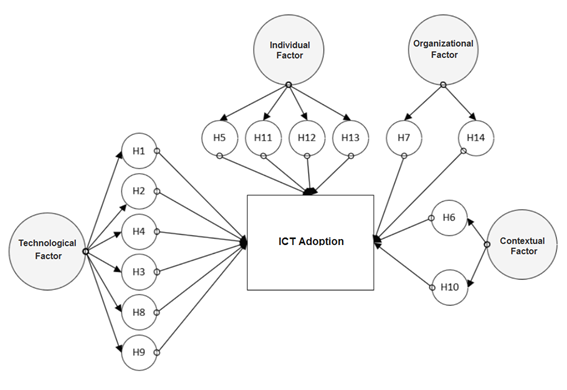
El modelo de la nueva distribución de atributos se muestra en la Figura 3.
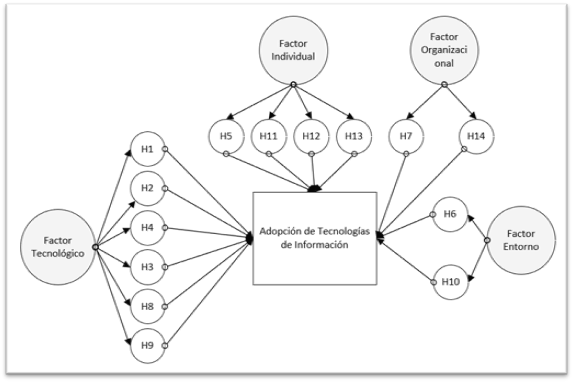
Figura 3. Modelo - Análisis factorial.
Fuente: Elaboración propia.
Por el tipo de modelo propuesto en la investigación es necesario trabajar con base en los 14 atributos. En la Tabla 4, se aprecia la consistencia interna de cada uno de ellos, todos los atributos tienen un coeficiente alfa de Cronbach superior a 0.81; es decir, las consistencias internas son las adecuadas.
En total, el coeficiente alfa de Cronbach de los 54 ítems es de 0.961, lo que demuestra que tienen una consistencia muy buena en conjunto.
Tabla 6. Resumen resultado prueba de hipótesis.
|
Atributo crítico de éxito |
Sig. |
Correlación |
||
|
|
Hipótesis general |
0.000 |
0.770 |
Correlación positiva considerable |
|
V1 |
Beneficios percibidos |
0.000 |
0.780 |
Correlación positiva considerable |
|
V2 |
Complejidad percibida |
0.000 |
0.670 |
Correlación positiva media |
|
V3 |
Seguridad percibida |
0.000 |
0.611 |
Correlación positiva media |
|
V4 |
Costo percibido |
0.000 |
0.606 |
Correlación positiva media |
|
V5 |
Preparación tecnológica de los usuarios |
0.000 |
0.758 |
Correlación positiva considerable |
|
V6 |
Experiencia tecnológica previa |
0.622 |
0.036 |
No existe correlación alguna entre las variables |
|
V7 |
La resistencia al cambio |
0.544 |
-0.044 |
No existe correlación alguna entre las variables |
|
V8 |
La cultura organizacional |
0.000 |
0.586 |
Correlación positiva media |
|
V9 |
Presión de los proveedores |
0.000 |
0.597 |
Correlación positiva media |
|
V10 |
Presión de los competidores |
0.561 |
0.042 |
No existe correlación alguna entre las variables |
|
V11 |
Apoyo gubernamental |
0.000 |
0.564 |
Correlación positiva media |
|
V12 |
Compromiso de la alta gerencia |
0.000 |
0.553 |
Correlación positiva media |
|
V13 |
Actitudes de los gerentes hacia la adopción de TI |
0.000 |
0.772 |
Correlación positiva considerable |
|
V14 |
Experiencia TIC de la gerencia |
0.000 |
0.271 |
Correlación negativa media |
Fuente: Elaboración propia.
Como se observa en la tabla anterior, se acepta la hipótesis general, debido a que el nivel de significancia resultante de la prueba es menor a 0.05. Además, la hipótesis general tiene correlación positiva considerable, dado que la correlación resultante es 0.770.
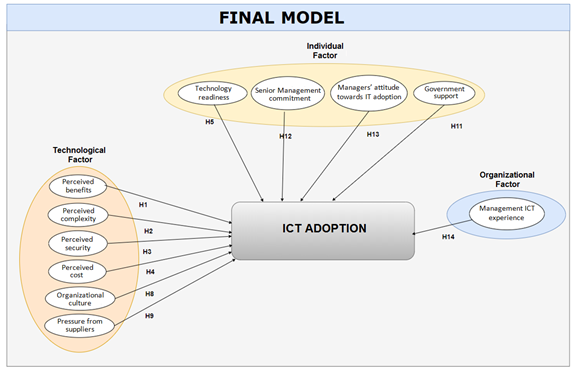
Modelo final
El modelo final se muestra en la Figura 4. Este no incluye el factor “entorno”, puesto que sus atributos críticos fueron rechazados porque obtuvieron niveles de significancia mayores a 0.05 en el resultado de las hipótesis.
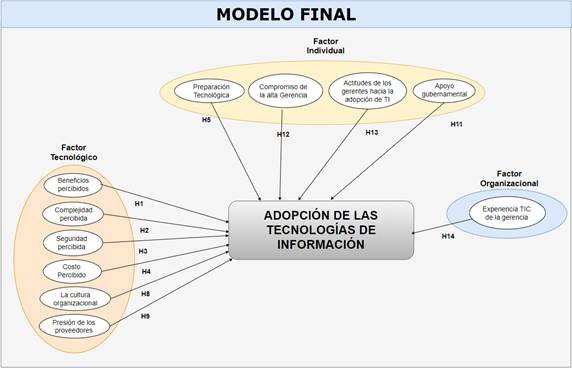
Figura 4. Modelo resultante de las hipótesis aceptadas.
Fuente: Elaboración propia.
DISCUSIÓN
El atributo crítico experiencia TIC de la gerencia (14) se acepta porque el nivel de significancia es menor a 0.05, con 0.271 de correlación negativa débil.
En el caso de los atributos críticos beneficios percibidos (V1), preparación tecnológica de los usuarios (V5) y actitudes de los gerentes hacia la adopción de las TIC (V13), se observa una correlación positiva considerable, dado que la correlación resultante oscila entre 0.758 y 0.780. Por tanto, se puede decir que existe una correlación positiva considerable entre estos atributos planteados y la adopción de tecnologías de la información y comunicación en las mypes industriales de Lima Metropolitana.
En el caso de los atributos críticos seguridad percibida (V3), costo percibido (V4), cultura organizacional (V8), presión de los proveedores (V9), apoyo gubernamental (V11) y compromiso de la alta gerencia (V12), se observa una correlación positiva media, dado que la correlación resultante oscila entre 0.553 y 0.611. Por tanto, se puede decir que existe una correlación positiva media entre estas hipótesis planteadas y la adopción de tecnologías de la información y comunicación en las mypes industriales de Lima Metropolitana.
Por otra parte, los atributos críticos experiencia tecnológica previa (V6), resistencia al cambio (V7) y presión de los competidores (V10), se rechazan porque el nivel de significancia es mayor a 0.05.
El marco conceptual propuesto permite a los investigadores probar y comprender empíricamente los factores críticos para la adopción de las TIC en las mypes de Lima Metropolitana. Esto es importante para la adopción exitosa de las TIC en las mypes.
Dentro de este marco propuesto, se pueden analizar los patrones actuales de adopción de las TIC y se pueden proporcionar sugerencias específicas para mejorar el modelo.
El estudio también contribuye a mejorar el conocimiento de los factores críticos para la adopción de las TIC en las mypes y ayuda a los gerentes a mejorar en la evaluación de la condición de la empresa y los posibles factores que conducirían a la adopción exitosa de las TIC en sus empresas.
Asimismo, se espera que los resultados de esta investigación contribuyan al campo académico, la pequeña y mediana empresa, las firmas consultoras y los proveedores de software y las agencias gubernamentales.
CONCLUSIONES
En esta investigación se demuestra que existe correlación entre los atributos propuestos en el modelo y la adopción de las TIC en las mypes industriales de Lima Metropolitana, lo que queda evidenciado en la Tabla 6.
Se evidencia que los atributos críticos “experiencia tecnológica previa”, “resistencia al cambio” y “presión de los competidores” no tienen correlación con la adopción de tecnologías de la información y comunicación en las empresas industriales de Lima Metropolitana.
En la investigación se evidencia que el factor “entorno” desaparece en el modelo final para la adopción de tecnologías de la información y comunicación en las empresas industriales de Lima Metropolitana, dado que los atributos propuestos no son influyentes.
En la presente investigación, se analizaron catorce atributos críticos; sin embargo, puede haber otros que también son importantes y no fueron considerados en el desarrollo de este modelo.
RECOMENDACIÓN
Se recomienda aplicar el modelo final a las Zonas restantes del APEIM 2020, según industria y naturaleza de los productos que se desarrollan con la finalidad de evaluar el modelo y analizar los resultados.
REFERENCIAS BIBLIOGRÁFICAS
[1] Alrawabdeh, W. (2014). Environmental Factors Affecting Mobile Commerce Adoption-An Exploratory Study on the Telecommunication Firms in Jordan. International Journal of Business and Social Science. 5 (8)., 151-164.
[2] Chang, S., Hung, S., Yen, D., y Lee, P. (2010). Critical Factors of ERP Adoption for Small- and Medium- Sized Enterprises: An Empirical Study. Journal of Global Information Management (JGIM), 18(3), 82-106. Recuperado de http://doi.org/10.4018/jgim.2010070104
[3] Chau, N., y Deng, H. (2018). Critical Determinants for Mobile Commerce Adoption in Vietnamese SMEs: A Conceptual Framework. Procedia Computer Science, 138, 433-440. Recuperado de https://doi.org/10.1016/j.procs.2018.10.061
[4] Chen, J., Windasari, N., y Pai, R. (2013). Exploring E-Readiness on E-Commerce Adoption of SMEs: Case Study South-East Asia. IEEE International Conference on Industrial Engineering and Engineering Management. Recuperado de https://doi.org/10.1109/IEEM.2013.6962637
[5] Chiavenato, I. (2002). Introducción a la teoría general de la administración. 5.ª ed. . México D. F.: McGraw-Hill.
[6] Cuevas-Vargas, H., Estrada, S., y Larios-Gómez, E. (2016). The effects of ICTs as innovation facilitators for a greater business performance. Evidence from Mexico. Procedia Computer Science, 91, 47-56. Recuperado de https://doi.org/10.1016/j.procs.2016.07.040
[7] Duan, X., Deng, H., y Corbitt, B. (2012). What drives the adoption of electronic markets in Australian small-and-medium sized enterprises? - An empirical study. ACIS 2012 Proceedings. 20. Recuperado de https://aisel.aisnet.org/acis2012/20
[8] Gangwar, H., Date, H., y Ramaswamy, R. (2015). Understanding determinants of cloud computing adoption using an integrated TAM-TOE model. Journal of Enterprise Information Management, 28 (1), 107-130. Recuperado de https://doi.org/10.1108/JEIM-08-2013-0065
[9] Gibson, J., Ivancevich, J., Donelly, J., y Konospake, R. (2006). Organizaciones: Comportamiento, Estructura y Procesos. 12.ª ed. México, D. F.: Mc-Graw Hill.
[10] Hassan, H. (2017). Organisational factors affecting cloud computing adoption in small and medium enterprises (SMEs) in service sector. Procedia Computer Science, 121, 976–981. Recuperado de https://doi.org/10.1016/j.procs.2017.11.126
[11] Hernández, R., Fernández, C., y Baptista, P. (2014). Metodología de la investigación (6a. ed.). México D.F.: McGraw-Hill.
[12] INEI (2020). PERÚ: Tecnologías de Información y Comunicación en las Empresas, 2017. Encuesta Económica Anual 2018. Recuperado de https://www.inei.gob.pe/media/MenuRecursivo/publicaciones_digitales/Est/Lib1719/libro.pdf
[13] Luiz, A., Costa, C., Dos Santos, J., y Tsutsumi, M. (2020). Resistance to change as function of different physical-effort requirements in humans. Behavioural Processes, 176. Recuperado de https://doi.org/10.1016/j.beproc.2020.104123
[14] Morteza, G., Arias-Aranda, D., y Benitez-Amado, J. (2011). Adoption of e-commerce applications in SMEs. Industrial Management & Data Systems, 111(8), 1238-1269. Recuperado de https://doi.org/10.1108/02635571111170785
[15] Oliveira, T., y Martins, M. (2010). Understanding e-business adoption across industries in European countries. Industrial Management & Data Systems, 110 (9), 1337-1354. Recuperado de https://doi.org/10.1108/02635571011087428
[16] Rahayu, R., y Day, J. (2015). Determinant Factors of E-commerce Adoption by SMEs in Developing Country: Evidence from Indonesia. Procedia - Social and Behavioral Sciences, 195, 142 – 150. Recuperado de https://doi.org/10.1016/j.sbspro.2015.06.423
[17] Rauta, R., Gardas, B., Jha, M., y Priyadarshinee, P. (2017). Examining the critical success factors of cloud computing adoption in the MSMEs by using ISM model. The Journal of High Technology Management Research. 28, 125-141. Recuperado de https://doi.org/10.1016/j.hitech.2017.10.004
[18] Rogers, E., y Shoemaker, F. (1971). Communication of Innovations: A Cross-cultural Approach. Free Press, New York, NY.
[19] Singh, R., Luthra, S., Mangla, S., y Uniyal, S. (2019). Applications of information and communication technology for sustainable growth of SMEs in India food industry. Resources, Conservation & Recycling,147, 10-18. Recuperado de https://doi.org/10.1016/j.resconrec.2019.04.014
[20] Sulaiman, A. (2000). The status of e-commerce applications in Malaysia. Information Technology for Development. 9, 153-161. Recuperado de https://doi.org/10.1080/02681102.2000.9525329
[21] Thong, J. (1999). An Integrated Model of Information Systems Adoption in Small Business. Journal of Management Information Systems, 15 (4), 187-214. Recuperado de https://doi.org/10.1080/07421222.1999.11518227
[22] Tornatzky, L., y Fleischer, M. (1990). The process of technology innovation. Lexington, MA: Lexington Books.
[23] Zhu, K., y Kenneth, K. (2005). Post-Adoption Variations in Usage and Value of E-Business by Organizations. Information Systems Research. 16 (1), 61-84. Recuperado de http://dx.doi.org/10.1287/isre.1050.0045
[24] Zhu, K., Kraemer, K., y Xu, S. (2006). The Process of Innovation Assimilation by Firms in Different Countries: A Technology Diffusion Perspective on E-Business. Management Science, 52(10), 1557-1576. Recuperado de https://doi.org/10.1287/mnsc.1050.0487
Revista Industrial Data 24(2): 273-292 (2021)
DOI: https://doi.org/10.15381/idata.v24i2.20736
ISSN: 1560-9146 (Impreso) / ISSN: 1810-9993 (Electrónico)
Received: 05/07/2021
Accepted: 01/11/2021
Published: 31/12/2021
Critical Factors for ICT Adoption in Industrial Sector Micro and Small Enterprises (MSEs)
Edgar Fernando Vasquez Reyes[2]
ABSTRACT
Micro and small-sized enterprises (MSEs) employ approximately 60% of the economically active population (EAP) in our country, but only 15% of them have access to information and communication technologies (ICTs). Therefore, it is believed that these companies do not understand ICTs, do not value them or give them due importance and are reluctant to adopt and use ICTs. This non-experimental research aims to find evidence of the relationship between critical factors and the adoption of information technologies in this type of company. To this end, a survey was conducted among 179 businessmen in Metropolitan Lima. Following the evaluation and analysis of the data obtained, it was found that 11 factors have a positive correlation for the adoption of information technologies and 3 are rejected because the significance level obtained is greater than 0.05. Thus, a new model of ICT adoption based on the 11 accepted factors is created for this type of company.
Keywords: MSE, ICT, TOE, technology adoption, manufacturing industry.