Revista Industrial Data 27(2): 173-192 (2024)
DOI: https://doi.org/10.15381/idata.v27i2.25561
ISSN: 1560-9146 (Impreso) / ISSN: 1810-9993 (Electrónico)
Improving Productivity in Electrowelded Pipe Production Lines through the Development of a Maintenance Plan Based on Autonomous Maintenance
Carlos Antonio Porras Guzmán[1]
Production and Management
Submitted: 16/06/2023 Accepted: 10/04/2024 Published: 31/12/2024
DOI https://doi.org/10.15381/idata.v27i2.25561.g20456
ABSTRACT
This research aimed to increase the efficiency of electrowelded pipe production by developing a maintenance plan based on autonomous maintenance. This approach allows machine operators to perform industrial maintenance tasks, rather than relying solely on maintenance technicians. As a result of implementing the 5S methodology, conducting a time study, and establishing a comprehensive maintenance plan, plant productivity increased from 77% to 152%. The model proved effective in increasing productivity by raising overall equipment effectiveness (OEE) from 37.43% to 82.74%.
Keywords: autonomous maintenance, lean manufacturing, productivity, OEE (overall equipment effectiveness), CTQ (critical to quality).
INTRODUCTION
According to the World Bank’s edition of the World Economic Outlook, the global economy is experiencing a significant slowdown due to new threats posed by COVID-19 variants, alongside rising debt, inflation, and income inequality. These factors could jeopardize the recovery of developing and emerging countries. As global fiscal and monetary support decreases, global growth is projected to decline significantly, dropping from 5.5% in 2021 to 4.1% in 2022, and further down to 3.2% in 2023 (Banco Mundial, 2022).
This year, steel demand is expected to increase by only 0.4%, reaching 1,840 million tons, below the 2.7% increase forecasted in 2021. This slowdown is primarily due to the impact of the Ukraine crisis and rising prices. The conflict is expected to affect the steel industry by increasing raw material and energy costs, as a result of disruptions in the global supply chain (Forbes, 2022, p. 25).
The construction sector has experienced a remarkable increase of 34.7% in recent years, making it the most sustainable economic activity. It is closely followed by the manufacturing sector, which has grown by 17.7%, and the mining and hydrocarbons sector, with a growth rate of 7.4%.
The company under study is located in the province of Chimbote and specializes in the production and sale of steel. In response to current challenges, the company has been compelled to improve its processes and minimize defects to boost productivity. Consequently, the objective of this article is to propose and implement a maintenance plan based on autonomous maintenance, supported by the tools of total productive maintenance (TPM). This plan is designed to improve the quality, standardization, and time efficiency of the company’s production process. It is expected that this model will not only achieve its objectives within the examined company but can also be applied to other companies in the industrial sector that face similar challenges.
This research aims to demonstrate that implementing autonomous maintenance in the manufacture of electrowelded pipes in a steel plant can significantly increase productivity. The proposed paradigm is suitable for application in similar contexts, as evidenced by the considerable productivity improvements observed after the introduction of the continuous improvement model. This paper is intended to serve as a resource in the research field for both researchers, guiding further studies based on continuous process improvement, and for companies in the industrial sector seeking a lean manufacturing model to enhance their processes.
The significance and originality of this research study stem from the development of a model based on selected tools to tackle the main challenges in the steel sector, including worker training, machine maintenance, disorderliness, lack of cleanliness, and prolonged cycle time, all of which impact productivity.
This research study contributes to the growth of the sector by proposing a maintenance plan based on autonomous maintenance, providing a new approach to continuous improvement within the steel industry and the research sector.
Autonomous maintenance is essential for effectively managing the operational processes of companies. In his study, Jima (2015) employed various tools, including a prioritization matrix, questionnaires, FMEA tables, interviews, and preset time systems, to develop a comprehensive maintenance system for the company Centro de la Madera. The study involved four participants: three plant employees and one administrative staff member. They were surveyed and interviewed to assess the current state of machine maintenance and each employee’s safety plans. Consequently, descriptive field, pre-experimental, correlational, and longitudinal descriptive study designs were used as research methods. The result of this effort was the implementation of a comprehensive industrial safety and maintenance system.
According to Martínez, various approaches, including kanban, kaizen, autonomous maintenance, just-in-time (JIT), benchmarking, total quality control, and continuous improvement, are supported by a quasi-experimental, applied, descriptive, correlational, and cross-sectional quantitative design. Companies engaged in the production of goods that aimed to maintain their machinery, facilities, and equipment in excellent working order proposed to apply the principles of total productive maintenance (TPM) and foster a change in mindset among their personnel to achieve desired results. The workforce is a key factor in transforming processes through training and incentives. The findings indicated that this approach was effective only 30% of the time, particularly when staff members adapted their work environments and worked as individuals and teams. They experienced constructive and cooperative development, and some employees even successfully applied these concepts at home (Martínez, 2009).
Productivity
Optimal equipment productivity requires a combination of operational and maintenance strategies, as no equipment can be truly productive without adequately trained personnel in both production and maintenance. It is common for organizations to have a department in charge of maintaining ideal operating conditions, which seeks collaboration and support from other departments, especially those directly involved in production and maintenance. Ideally, operators should be able to perform simple and quick tasks to keep the equipment operational rather than specific maintenance. Achieving productivity is challenging for any company without a clear, well-defined, and shared strategy, as well as a concrete structure and an appropriate distribution of responsibilities aligned with that structure (Carro & Gonzáles, 2024).
Autonomous Maintenance
The efficient use of equipment has been crucial in reducing costs and enhancing the competitiveness of companies. Maintenance performed by employees, often referred to as “autonomous maintenance”, improves equipment efficiency and prevents its degradation (Cáceres, 2019).
It is a fact that the lack of interest among operators to perform new activities will not change overnight. Changing attitudes is a challenging process that requires time, and it is hard for them to abandon their usual work habits; usually, operators focus full-time on production while maintenance personnel handle repair responsibilities (Castelo, 2017).
El mantenimiento autónomo busca alcanzar los seis objetivos descritos a continuación. Emplear la máquina/equipo como instrumento para el aprendizaje y adquisición de conocimientos. Desarrollar nuevas habilidades para el análisis de problemas y creación de un nuevo pensamiento sobre el trabajo, mediante una operación correcta y permanente que evite el deterioro. Mejorar el funcionamiento de la máquina con el aporte creativo del operador. Construir y mantener la máquina en condiciones óptimas. Mejorar la seguridad en el trabajo. Mejorar la moral en el ambiente de trabajo [Autonomous maintenance aims to achieve six key objectives: 1) to use machines and equipment as tools for learning and knowledge acquisition, 2) to develop new skills for problem analysis and encourage innovative thinking about work through consistent and proper operation to prevent deterioration, 3) to enhance machine operation with creative input from operators, 4) to build and maintain equipment in optimal condition, 5) to improve workplace safety, and 6) to boost morale in the work environment]. (Montilla, 2019, p. 185)
Lean Manufacturing
Lean manufacturing es un nuevo modelo de organización y gestión del sistema de fabricación que persigue la mejor calidad, el menor lead time y el menor coste mediante la eliminación continua del despilfarro.… La implantación de las metodologías y herramientas del lean manufacturing es muy sensible a la actitud y participación de las personas. Es imprescindible que la dirección lidere, impulse y apoye, con rigor y constancia, el lean manufacturing [ Lean is a new model for organizing and managing manufacturing systems, focusing on achieving the best quality, the shortest lead times, and the lowest costs through the continuous elimination of waste…. The implementation of lean manufacturing methodologies and tools is highly dependent on the attitudes and engagement of the workforce. Management must lead, drive, and support these initiatives with thoroughness and determination]. (Madariaga, 2023, pp. 25-26)
The ultimate goal of lean manufacturing is to improve quality, reduce costs, and shorten the time between customer orders and product shipments.
5S
The 5S methodology focuses on systematically managing the components of a workplace through five steps that require perseverance and effort. It aims to organize work routines to reduce waste and maintain tidy and clean work areas.
Profitability and Competitiveness
La rentabilidad es el beneficio renta en términos relativos o porcentuales respecto a otra magnitud económica como el capital total invertido o los fondos propios [Profitability refers to the profit earned relative to another economic measure, such as total invested capital or equity] (Cáceres, 2019, p. 8).
The market ultimately serves as the final judge; it dictates how the industrial sector must design, produce, and sell products. Companies must create more appealing offerings than similar products offered by competitors.
CTQ
The parameters that are critical to meeting the customer quality requirements are known as CTQ, which stands for “critical to quality”. This process involves prioritizing the characteristics that contribute to the desired outcomes and eliminating those that are not essential to meet the customer’s needs.
The characteristics that satisfy a key customer requirement are defined as the CTQ for any product, process, or service. As noted, CTQ directly conveys the voice of the customer, providing a comprehensive understanding of their needs.
METHODOLOGY
SidePerú is the leading steel company in Peru that specializes in the manufacturing and sale of steel products. Since its establishment in 1956, it has produced and distributed high-quality steel goods. Its steel complex is located in Chimbote, covering an area of 600 hectares, and has a production capacity exceeding 600 000 tons of finished steel products annually. The complex consists of multiple areas, including reduction, steelmaking, flat and long product rolling, coated flat product rolling, tubular products, rails, and numerous auxiliary facilities. Additionally, it features a quay designed to accommodate ships with a capacity of up to 50 000 tons.
The simple random finite population sampling formula was used across the entire company to determine the sample size. This method helped to identify which specific section to analyze, selecting the one with the number of employees closest to the sample number. As a result, the pipe section was selected, as it employs the largest number of workers.
The pipe section is divided into two categories of machinery: cold machines (M2, TMC, M2.5) and hot machines (YODER FERRUM, SHULTER FERRUM, W35). There are 62 operators, 6 setup workers, 3 supervisors, and 3 quality inspectors, resulting in a total of 74 employees working in three shifts at the plant.
RESULTS
Statistical Hypotheses
The implementation of autonomous maintenance in the electrowelded pipe manufacturing process at the steel manufacturing plant improves productivity. The feasibility of this assumption will be tested at a significance level of α = 0.05.
· H0 = The implementation of autonomous maintenance in the electrowelded pipe manufacturing process at the steel manufacturing plant does not improve productivity.
· H1 = The implementation of autonomous maintenance in the electrowelded pipe manufacturing process at the steel manufacturing plant improves productivity.
A CTQ matrix was developed to assess the quality of the tubular products produced by the steel manufacturing company. The analysis revealed that none of the gaps exceeded 5%, indicating that product quality was not the issue. However, the highest value (4.50) was found in manufacturing, prompting the analysis to focus on this area. Table 1 below presents the CTQ matrix.
Table 1. CTQ Matrix.
|
CTQ |
Importance |
Plan |
Source |
Make |
Delivery |
Return |
Satisfaction |
Dissatisfaction |
Gap |
||
|
No. |
% |
Planning |
Indicators |
Resources |
Manufacturing |
Distribution |
Returns |
||||
|
Updated Offers |
8 |
20% |
3 |
0 |
0 |
9 |
3 |
0 |
80% |
20% |
4.00 |
|
Credit Facility |
7 |
18% |
9 |
0 |
0 |
0 |
3 |
0 |
76% |
24% |
4.20 |
|
Stock Replenishment for Sale |
10 |
25% |
3 |
1 |
0 |
9 |
0 |
0 |
90% |
10% |
2.50 |
|
Variety of Tubular Products |
9 |
23% |
0 |
0 |
0 |
9 |
3 |
0 |
83% |
17% |
3.83 |
|
Friendly Sales Staff |
6 |
15% |
0 |
0 |
9 |
0 |
3 |
0 |
72% |
28% |
4.20 |
|
40 |
|
2.18 |
0.00 |
1.35 |
3.83 |
2.25 |
0.00 |
||||
Source: Prepared by the author.
A brainstorming exercise was carried out to analyze the possible causes (X) that might affect the process. This analysis served as a basis for identifying the main variables that contribute to a significant amount of waste (Y) in the process. To aid in this analysis, the Ishikawa cause-and-effect diagram was used, focusing on the productivity of electrowelded pipes, as illustrated in Figure 1.
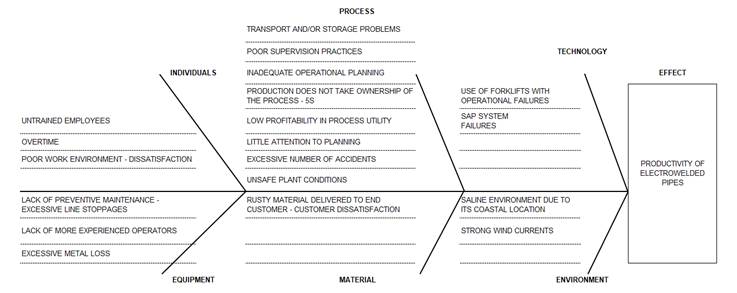
Figure 1. Cause-and-effect diagram.
Source. Prepared by the author.
To determine which variables significantly impacted the generation of scrap during the process, the Delphi method, an expert judgment approach, was used to ascertain the possible root causes, as shown in Table 2.
Table 2. Determination of Possible Root Causes.
|
Detail |
Failure Mode |
Possible Root Cause |
Frequency |
Severity |
Controls |
Ratio |
|
|
Untrained employees |
Repeated production line stoppages due to lack of quick solutions |
Untrained employees |
3 |
3 |
4 |
36 |
X1 |
|
Increased overtime for plant personnel |
Fatigue experienced by operators and line maintainers |
Overtime |
3 |
2 |
3 |
18 |
|
|
Lack of commitment from employees |
Poor communication between operators and line maintainers |
Poor working environment leading to dissatisfaction |
4 |
3 |
3 |
36 |
X2 |
|
Repeated production line stoppages |
Equipment reliability issues |
Lack of preventive maintenance leading to excessive line stoppages |
4 |
4 |
3 |
48 |
X3 |
|
Excessive turnover rates among line employees |
Insufficient knowledge of line equipment |
Lack of more experienced operators |
3 |
2 |
3 |
18 |
|
|
Repeated production line stoppages |
Excessive scrap in the transit yard |
Excessive metal loss |
4 |
4 |
4 |
64 |
X4 |
|
Poor quality of the final product |
Internal customer complaints |
Transportation and/or storage problems |
2 |
2 |
2 |
8 |
X5 |
|
Disorganized procedures |
Inadequate supervision |
Poor supervision practices |
2 |
2 |
2 |
8 |
|
|
Lack of routine planning |
Products not meeting operational criteria |
Inadequate operational planning |
4 |
4 |
3 |
48 |
|
|
Dirty plant environment |
Tools and materials scattered throughout the plant |
Production does not take ownership of the process - 5S |
3 |
4 |
4 |
48 |
X6 |
|
Repeated production line stoppages |
Products not meeting operational criteria |
Low profitability in process utility |
4 |
4 |
3 |
48 |
X7 |
|
Instability in the manufacturing system |
Production based solely on demand |
Little attention to planning |
4 |
3 |
3 |
36 |
X8 |
|
Unstable plant conditions |
Occurrence of plant accidents |
Excessive number of accidents |
3 |
3 |
4 |
36 |
X9 |
|
Disorder in the plant |
Products not meeting operational criteria |
Unsafe plant conditions |
4 |
4 |
3 |
48 |
X10 |
|
Oxidation of products in storage |
Oxidation of tubular products |
Rusty material delivered to end customer - customer dissatisfaction |
4 |
4 |
4 |
64 |
X11 |
|
Equipment stopped due to lack of raw materials |
Forklift failure |
Use of forklifts with operational failures |
2 |
2 |
3 |
12 |
|
|
SAP system downtime |
Stopped production lines |
SAP system failures |
3 |
3 |
3 |
27 |
|
|
Oxidation of product while in storage |
Oxidation of tubular products |
Saline environment due to its coastal location |
4 |
4 |
4 |
64 |
X12 |
|
Oxidation of product while in storage |
Oxidation of tubular products |
Strong wind currents |
3 |
3 |
3 |
27 |
Source: Prepared by the author.
Data related to these 12 variables was collected over 18 months, from July 2018 to December 2019 (see Table 3). Additionally, productivity data for the same period was also gathered.
Table 3. Data Collection of 12 Variables over 18 Months (July 2018 - December 2019).
|
Detail |
Month |
Productivity (Y) |
Trained personnel (X1) |
% Approval of work environment (X2) |
% Deviation from scheduled shutdowns for preventive maintenance (X3) |
% Metallic loss (X4) |
% Customer complaints (X5) |
Observations reported (X6) |
% Variation of planned vs. actual production costs (X7) |
% Scheduled tons completed on time (X8) |
% Accidents with time loss (X9) |
% Unsafe conditions reported (X10) |
% Material with oxidation (X11) |
% Tons placed under observation (X12) |
|
Before Implementation |
Jul-18 |
0.77 |
27.4% |
16.4% |
23.3% |
1.1% |
1.1% |
31.3% |
121.3% |
96.4% |
13.7% |
15.4% |
1.1% |
2.6% |
|
Aug-18 |
0.77 |
33.3% |
22.2% |
20.0% |
1.0% |
0.9% |
40.0% |
109.3% |
85.2% |
4.1% |
57.1% |
1.3% |
5.4% |
|
|
Sep-18 |
0.70 |
31.5% |
21.9% |
22.4% |
0.8% |
0.8% |
41.9% |
107.1% |
108.0% |
9.6% |
23.1% |
0.5% |
3.1% |
|
|
Oct-18 |
0.76 |
30.6% |
20.8% |
23.5% |
0.9% |
1.0% |
28.6% |
111.3% |
81.5% |
5.5% |
57.1% |
0.4% |
2.4% |
|
|
Nov-18 |
0.78 |
26.0% |
15.1% |
16.7% |
1.0% |
1.0% |
27.3% |
103.5% |
71.4% |
1.4% |
41.7% |
1.4% |
7.9% |
|
|
Dec-18 |
0.79 |
26.4% |
16.7% |
12.5% |
1.2% |
1.0% |
26.7% |
101.2% |
86.2% |
6.8% |
30.8% |
1.6% |
2.3% |
|
|
Jan-19 |
0.82 |
27.4% |
17.8% |
14.7% |
1.0% |
0.8% |
32.3% |
110.0% |
86.7% |
8.2% |
57.1% |
1.0% |
0.8% |
|
|
Feb-19 |
1.02 |
20.8% |
11.1% |
16.4% |
1.0% |
0.8% |
26.7% |
112.5% |
87.5% |
2.8% |
18.2% |
0.3% |
2.1% |
|
|
Mar-19 |
1.08 |
30.1% |
21.9% |
8.6% |
0.5% |
0.6% |
37.0% |
102.6% |
97.0% |
11.0% |
30.0% |
2.1% |
3.5% |
|
|
Apr-19 |
1.01 |
29.4% |
20.6% |
9.0% |
0.5% |
0.6% |
35.7% |
105.1% |
90.6% |
4.4% |
77.8% |
0.6% |
2.4% |
|
|
May-19 |
1.06 |
35.7% |
27.1% |
8.3% |
0.5% |
0.5% |
52.2% |
109.0% |
96.9% |
5.7% |
20.0% |
2.5% |
2.1% |
|
|
Jun-19 |
1.09 |
30.6% |
22.2% |
9.2% |
0.6% |
0.5% |
40.0% |
110.4% |
88.2% |
12.5% |
75.0% |
0.2% |
5.7% |
|
|
Jul-19 |
0.99 |
37.8% |
31.1% |
6.0% |
0.5% |
0.4% |
51.9% |
110.4% |
92.9% |
4.1% |
55.6% |
1.1% |
2.1% |
|
|
Aug-19 |
1.09 |
33.8% |
27.0% |
8.0% |
0.6% |
0.5% |
50.0% |
116.9% |
71.0% |
2.7% |
18.2% |
0.3% |
0.5% |
|
|
Sep-19 |
1.24 |
35.3% |
30.9% |
4.4% |
0.5% |
0.4% |
40.0% |
103.9% |
96.8% |
10.3% |
62.5% |
0.6% |
2.2% |
|
|
Oct-19 |
1.19 |
31.4% |
28.6% |
7.0% |
0.6% |
0.5% |
38.5% |
110.4% |
88.9% |
12.9% |
66.7% |
0.3% |
2.9% |
|
|
Nov-19 |
1.24 |
26.8% |
25.4% |
5.9% |
0.6% |
0.5% |
37.0% |
103.9% |
98.5% |
4.3% |
20.0% |
0.8% |
2.3% |
|
|
Dec-19 |
1.25 |
32.9% |
24.3% |
4.0% |
0.5% |
0.4% |
33.3% |
106.8% |
90.9% |
7.1% |
42.9% |
0.2% |
1.4% |
Source: Prepared by the author.
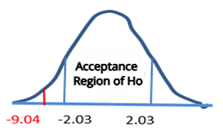
A correlation test was performed using Minitab 17, with a confidence level of 95%, involving the 12 variables. The test revealed that only variables X1, X2, X3, X4, X5, and X6 exhibited a high correlation with waste generation (Y). Specifically, the Pearson correlation coefficient for these variables is either greater than 0.5 or less than −0.5 and their p-values are less than 0.05, as can be seen in Table 4.
Table 4. Correlation of Variables.
|
Variable |
Pearson |
p-value |
|
X1 |
0.8590 |
0.0000 |
|
X2 |
0.9640 |
0.0000 |
|
X3 |
−0.5830 |
0.0110 |
|
X4 |
−0.7100 |
0.0010 |
|
X5 |
−0.7330 |
0.0010 |
|
X6 |
0.7200 |
0.0010 |
|
X7 |
−0.2030 |
0.4200 |
|
X8 |
0.1450 |
0.5660 |
|
X9 |
0.0630 |
0.8050 |
|
X10 |
0.2870 |
0.2480 |
|
X11 |
−0.0660 |
0.7950 |
|
X12 |
−0.1500 |
0.5540 |
Source: Prepared by the author.
As illustrated, the six variables strongly correlated to waste generation (Y) in the initial productivity diagnosis were X1, X2, X3, X4, X5, and X6.
The regression was performed on these variables, excluding those that do not contribute significantly due to high p-values. The results yielded an R-squared (R2) and adjusted R-squared (R2adj) of less than 10%, and the p-value of the equation close to 0.05. Figure 2 displays the regression analysis of these variables.
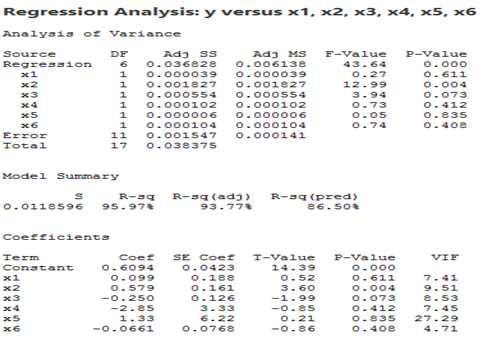
Figure 2. Regression analysis of variables.
Source: Prepared by the author.
Although the obtained values are optimal, they can be enhanced further by removing X5 because it has the highest p-value. The regression analysis of variables without X5 is presented in Figure 3.
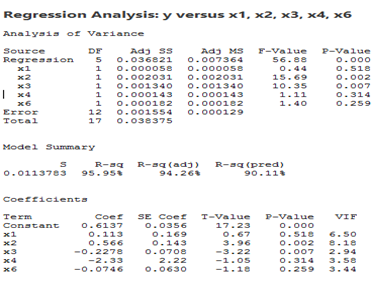
Figure 3. Regression analysis of variables without X5.
Source: Prepared by the author.
The following equation was obtained:
Y = 0.6137 + 0.113 X1 + 0.566 X2 − 0.2278 X3 − 2.33 X4 − 0.0746 X6
As observed, the variables that need to be addressed to improve productivity in the plant are related to workforce management and equipment knowledge. Therefore, involving employees in daily tasks is essential to improve asset availability, reduce costs, and increase the productive efficiency of the equipment. Although there are various methodologies to improve maintenance management, the decision was made to implement autonomous maintenance as a strategy for continuous improvement.
Hypothesis Testing
After obtaining the results and defining the methodology, the decision was made to implement the management system and monitor the results over the next 18 months. Table 5 presents the data collected for the relevant variables from January 2020 to June 2021, following the implementation of autonomous maintenance.
Table 5. Data Collection of Variables over 18 Months (January 2020 - June 2021) After Implementing Autonomous Maintenance.
|
Detail |
Month |
Productivity (Y) |
Trained personnel (X1) |
% Approval of the work environment (X2) |
% Deviation from scheduled shutdowns for preventive maintenance (X3) |
% Metal loss (X4) |
% Customer complaints (X5) |
Observations reported (X6) |
% Variation of planned vs. actual production costs (X7) |
% Scheduled tons completed on time (X8) |
% Accidents with time loss (X9) |
% Unsafe conditions reported (X10) |
% Material with oxidation (X11) |
% Tons placed under observation (X12) |
|
After Implementation |
Jan-20 |
1.31 |
29.2% |
22.2% |
3.3% |
0.5% |
0.3% |
45.5% |
105.4% |
98.6% |
1.4% |
80.0% |
0.1% |
1.3% |
|
Feb-20 |
1.21 |
25.7% |
18.9% |
2.9% |
0.5% |
0.4% |
47.6% |
101.4% |
98.4% |
1.4% |
40.0% |
0.1% |
1.9% |
|
|
Mar-20 |
1.23 |
29.4% |
25.0% |
2.0% |
0.5% |
0.2% |
60.0% |
101.4% |
98.5% |
0.0% |
50.0% |
0.1% |
1.6% |
|
|
Apr-20 |
1.33 |
33.8% |
27.9% |
2.2% |
0.5% |
0.2% |
66.7% |
102.8% |
98.6% |
1.5% |
60.0% |
0.1% |
1.1% |
|
|
May-20 |
1.39 |
35.3% |
30.9% |
2.1% |
0.4% |
0.1% |
92.3% |
102.8% |
98.6% |
0.0% |
100.0% |
0.1% |
1.3% |
|
|
Jun-20 |
1.40 |
35.7% |
35.7% |
0.8% |
0.5% |
0.1% |
91.7% |
102.9% |
98.6% |
0.0% |
66.7% |
0.1% |
0.9% |
|
|
Jul-20 |
1.44 |
31.4% |
31.4% |
0.3% |
0.4% |
0.2% |
90.0% |
102.9% |
98.7% |
1.4% |
100.0% |
0.1% |
0.6% |
|
|
Aug-20 |
1.48 |
31.9% |
31.9% |
0.0% |
0.4% |
0.1% |
87.5% |
102.9% |
98.7% |
0.0% |
66.7% |
0.1% |
1.0% |
|
|
Sep-20 |
1.52 |
31.1% |
29.7% |
0.0% |
0.4% |
0.2% |
100.0% |
102.9% |
98.8% |
0.0% |
100.0% |
0.1% |
0.4% |
|
|
Oct-20 |
1.52 |
38.6% |
40.0% |
0.5% |
0.4% |
0.1% |
100.0% |
102.9% |
98.8% |
0.0% |
100.0% |
0.1% |
0.2% |
|
|
Nov-20 |
1.52 |
41.4% |
45.7% |
0.0% |
0.4% |
0.1% |
100.0% |
102.9% |
98.8% |
0.0% |
100.0% |
0.0% |
0.2% |
|
|
Dec-20 |
1.52 |
38.6% |
42.9% |
0.0% |
0.4% |
0.0% |
100.0% |
101.5% |
98.8% |
0.0% |
100.0% |
0.0% |
0.2% |
|
|
Jan-21 |
1.52 |
44.3% |
50.0% |
0.0% |
0.4% |
0.0% |
100.0% |
102.9% |
98.8% |
0.0% |
100.0% |
0.0% |
0.2% |
|
|
Feb-21 |
1.52 |
45.7% |
54.3% |
0.4% |
0.3% |
0.0% |
100.0% |
102.9% |
98.8% |
0.0% |
100.0% |
0.0% |
0.2% |
|
|
Mar-21 |
1.52 |
47.1% |
57.1% |
0.0% |
0.4% |
0.0% |
100.0% |
102.9% |
98.8% |
0.0% |
100.0% |
0.0% |
0.2% |
|
|
Apr-21 |
1.52 |
50.0% |
58.6% |
0.0% |
0.3% |
0.0% |
100.0% |
101.5% |
98.8% |
0.0% |
100.0% |
0.0% |
0.0% |
|
|
May-21 |
1.52 |
54.3% |
61.4% |
0.0% |
0.3% |
0.0% |
100.0% |
100.0% |
98.8% |
0.0% |
100.0% |
0.0% |
0.2% |
|
|
Jun-21 |
1.52 |
57.1% |
64.3% |
0.0% |
0.3% |
0.0% |
100.0% |
100.0% |
98.8% |
0.0% |
100.0% |
0.0% |
0.0% |
Source: Prepared by the author.
Table 6. Equality of Variances (%).
|
Before Implementation |
After Implementation |
|
0.77 |
1.31 |
|
0.77 |
1.21 |
|
0.70 |
1.23 |
|
0.76 |
1.33 |
|
0.78 |
1.39 |
|
0.79 |
1.40 |
|
0.82 |
1.44 |
|
1.02 |
1.48 |
|
1.08 |
1.52 |
|
1.01 |
1.52 |
|
1.06 |
1.52 |
|
1.09 |
1.52 |
|
0.99 |
1.52 |
|
1.09 |
1.52 |
|
1.24 |
1.52 |
|
1.19 |
1.52 |
|
1.24 |
1.52 |
|
1.25 |
1.52 |
Source: Prepared by the author.