Revista Industrial Data 27(1): 157-183 (2024)
DOI: https://doi.org/10.15381/idata.v27i1.25643
ISSN: 1560-9146 (Impreso) / ISSN: 1810-9993 (Electrónico)
Cell Layout to Reduce Downtime in the Production of Extruded Feed for Aquatic Fauna in an Aquaculture Plant in Lima, Peru
Guevara Regalado José Gabriel [1]
Flor de María Milagros Tapia Vargas [2]
Production and Management
Submitted: 10/08/2023 Accepted: 18/10/2023 Published: 30/07/2024
DOI: https://doi.org/10.15381/idata.v27i1.25947.g20444
ABSTRACT
This research presents the conception and implementation of a manufacturing cell aimed at addressing the issue of low efficiency and downtime in the extruded feed production system for aquatic fauna within an aquaculture plant in Lima, Peru. A thorough analysis was conducted to characterize the baseline and diagnose the current situation, upon the basis of which the configuration of a serpentine cell with nine workstations was proposed. The applied research with an explanatory level evaluated whether the implementation of the cell would reduce the downtime in the extruded feed production system. The results obtained confirmed the hypothesis and showed a significant improvement in the performance of the extruded feed production system for aquatic fauna in an aquaculture plant in Lima, Peru.
Keywords: cell layout, continuous flow, downtime, productivity.
INTRODUCTION
According to Research and Markets (2021) and the Food and Agriculture Organization (FAO, 2022), it is projected that the global market for aquaculture products will reach a compound annual growth rate of 5% from 2021 to 2026. This forecast highlights the potential and growth opportunities in the industry.
Analyses conducted by Guélac-Gómez et al. (2023) revealed that aquaculture production has undergone global sustained growth during the last three decades. Moreover, Borges et al. (2023) highlight the significant role of aquaculture in meeting the demand for meat and acknowledge it as an efficient, high-growth industry.
Despite the encouraging prospects and expansion opportunities, the aquaculture company under study faced significant challenges that prevented it from fully exploiting the growth potential in the aquaculture market.
Therefore, an urgent improvement in the process of producing extruded feed for aquatic fauna was required as several inefficiencies that affected the company’s competitive capacity and its ability to meet the demands of the constantly growing market were identified. This inefficiency was observed in long production routes, significant non-productive times (both planned and unplanned), and reprocessing in the extruder machine, which together represented approximately 10% of the unproductive time in the production chain. Additionally, the time taken for a unit to be completed by the production chain exceeded the takt time, and the line efficiency was low, at around 40%. Consequently, it was essential to implement more efficient and faster processes with the aim of increasing the pace and agility in the manufacturing of aquaculture feed.
One way to achieve this goal was migrating from a conventional plant layout to a cellular manufacturing layout.
The concept of cellular manufacturing has its roots in the innovations introduced by Henry Ford, who revolutionized the industrial paradigm by implementing a moving assembly line for vehicle mass production. This innovation was a milestone in the industrialization era, and its influence remains in companies that handle large production volumes.
Although Ford pioneered continuous flow, Benders and Badham (2000) documented the evolution of manufacturing cells. They highlight works published in the United States and Germany in the 1920s, which referred to the first classifications of products in families intended to enhance the organization of the resources.
However, the cellular manufacturing production system originated at Toyota in the 1950s, when the goal was to produce vehicles more quickly, flexibly, and at a lower cost following the Ford system. Unlike Ford’s model, cellular manufacturing is characterized by encouraging uninterrupted flows through processes that are more adaptable in terms of variety and volume.
In the 1970s, factors such as the oil crisis and slow economic growth led other Japanese manufacturers to adopt Toyota’s successful system known today as lean manufacturing. This influence expanded to the United States and Europe in the 1980s, with notable examples such as the Hewlett-Packard Company, which implemented manufacturing cells. Currently, these implementations continue to emerge due to the extensive benefits they provide. Without manufacturing cells, it is impossible to replicate Toyota’s planning, scheduling, and controlling system.
According to Rother and Harris (2001), cellular manufacturing can be described as a configuration in which people, machines, materials, and methods are combined to carry out the stages of a process sequentially. This type of layout allows for the grouping of elements belonging to the same family so they can be processed continuously in unit-flows or small batches.
Wemmerlöv and Johnson (2010) have documented exhaustive studies of cellular manufacturing system implementations that have led to a wide range of benefits, including productivity enhancement in the production system and cost, time, and inventory reductions, among others.
According to Ramesh et al. (2021), the design of a cellular layout directly impacts the performance of the manufacturing system, as it can increase inventory flow. However, to achieve sustainable long-term improvement, it is necessary to apply lean methodology, focusing on achieving continuous flows rather than simply using lean tools in isolation.
The factory floor is the place where significant resource investment is required. Thus, Zhao et al. (2020) state that the cellular manufacturing design constitutes a fundamental and advantageous layout because the distribution it offers simplifies the logistics of production and reduces space, downtime as well as delivery time. It also improves product quality.
Likewise, Vargas-Hernández et al. (2018) state that the success of implementing the Toyota system lies in the required cultural change and the importance of assessing the results obtained in each process stage.
Similarly, Liker and Meier (2006) point out that creating a continuous flow through the design of cellular manufacturing is often considered the main objective. However, in reality, the fundamental objective is to eliminate losses.
Considering all of the above, the primary focus of this research is to reduce and eliminate losses in the manufacturing system of extruded feed for aquatic fauna in an aquaculture plant in Lima, Peru, through a cellular plant layout. This will translate into an important boost to remain competitive in a rapidly growing market.
This research aims to contribute to boosting more economical, stable, and safe food supplies in our country and the region.
Although the research specifically addresses the challenges and needs of the aquaculture industry in Lima, Peru, it is not only relevant and applicable to this specific context. The results and methodologies developed in this research can be replicated by companies in various sectors or by researchers interested in improving practices in the management of manufacturing processes.
In addition, the industrial engineering and process engineering principles and tools that have been used contribute to the transfer of knowledge, since they have been integrated and applied systemically in this study. This is described in detail in the methodology section.
This research also promotes interdisciplinary contribution and knowledge generation, for it is a resource for investigations focused on sustainability and environmental aspects, process engineering, and aquaculture biology, among others.
Finally, this article aims to contribute to the academic environment since it could be addressed as a case study with the purpose of analyzing the practical application of theories and concepts focused on industrial engineering.
Problem, Objective and Hypothesis
A general vision of the problem and the initial situation of the extruded feed production system for aquatic fauna at the company under study has been provided in previous paragraphs. Nonetheless, an exhaustive characterization of the current production flow will be provided in the section named Baseline Identification and Diagnosis of the Current Situation.
Along with the identification and quantitative assessment of the production line under study and the improvement that can be achieved through the manufacturing cell, Salimbeni and Mamani (2020) agree on the need to introduce new technologies in the workplace and question the design of conventional production lines. This implies adopting cellular distributions that allow more flexibility, reduce delays, and improve the process flow.
The main objective of this research is to determine to what extent the implementation of cellular manufacturing design will reduce the downtime in the extruded feed production system for aquatic fauna within an aquaculture company in Lima, Peru.
The hypothesis proposed for this research is that the average difference in the downtime in the extruded feed production system for aquatic fauna in the aquaculture company in Lima, Peru, before and after the implementation of the manufacturing cell design, will be greater than zero.
Background
In the category of background based on systematic literature reviews, Junior et al. (2019) conducted a comprehensive review of different types of plant layout designs and concluded that most studies promoting cellular layout have shown it to be an effective alternative for improving the efficiency and flexibility of production processes.
Alternatively, Renna et al. (2023) highlighted that cellular manufacturing layouts are widely used due to their advantageous ability to combine job shop flexibility and flow shop productivity. The study provides an overview of the most recent work in cellular manufacturing design, driven by achieving sustainability of production systems as a consequence of incorporating energy costs into the design model of such systems.
Regarding background based on explanatory level research, Rafiee and Mohamaditalab (2020) conducted computational experiments to evaluate cell effectiveness and showed that machine failures played a key role in improving cell performance, especially in high-demand companies. In addition, they found that labor-related costs have a high impact on cellular design.
Gayathri et al. (2018) and Govender and Dewa (2022) implemented several lean techniques and focused their efforts on eliminating waste in production processes by identifying and eliminating bottlenecks through line load balancing. This way, they improved production efficiency and reduced direct manufacturing costs. In a similar line of research, Suganthini et al. (2017) used shojinka to rebalance the line and reorganize tasks so that all workstations had approximately the same cycle time. This allowed to reduce bottlenecks, downtime, and delay, and improve product delivery time.
Finally, Pantoja et al. (2017) created a procedure to organize resources in production cells and validated its feasibility by implementing it in a real case involving a Colombian company. The significant contribution of this study is not only the potential achievements with cellular distribution but also the simple application of grouping product families.
Justification
The types of manufacturing cells that can be configured today according to the characteristics of the products, quantities demanded, and the nature of the manufacturing routes are extensively described by Hales and Anersen (2002). They have also documented the benefits achieved thanks to various implementations of manufacturing cells in companies that have diverse product-process pairs. These achievements included the reduction in distances traveled (67-90%), reduction of industrial accidents related to product handling (50%-80%), time reduction of work in process (50%-90%), elimination of accumulated lead time (60%-95%), among others.
The adoption of cellular manufacturing, as Forghani et al. (2021) suggest, is presented as a justified and highly beneficial option. These plant layouts not only lead to significant improvements in factory floor performance and efficiency, but also allow for cost reduction, minimized downtime, and higher product quality. Furthermore, as supported by Baysan et al. (2019), the implementation of manufacturing cells can improve energy efficiency in production systems by eliminating waste and adapting to the specific characteristics of each process.
As Chiarini (2014) highlighted, cellular manufacturing layouts can also reduce environmental impacts in manufacturing companies. By eliminating or reducing operations that do not add value, these cells not only make the resources more productive but also supply significant improvements in environmental management. This perspective makes it possible not only to comply with social and environmental standards but also to move towards more sustainable and responsible production.
In the current context of highly volatile, uncertain, complex, and ambiguous markets, the adoption of manufacturing cells emerges as a fundamental strategy to boost the competitiveness of manufacturing companies. Empirical research supports this idea and shows how cellular distributions improve efficiency, reduce costs, compress times, and raise product quality. Therefore, they place companies in a stronger and more favorable position in the marketplace.
METHODOLOGY
Approach, Level and Design of the Study
This work takes a quantitative approach and is of an applied type, as it focuses on addressing specific challenges with the objective of seeking and consolidating knowledge for practical application.
The level of the research is explanatory since it seeks to study the causal link between variables to explain their behavior. This research is framed within an intrasubject pre-experimental design characterized by the lack of a control group. Moreover, an observation is carried out before and after the implementation of an independent variable as part of an intervention.
Population and Sample
The study population consisted of aquatic wildlife extruded feed production orders for 40 weeks from September 2020 to June 2021 and from July 2021 to April 2022. These time intervals corresponded to the pretest and posttest phases, respectively. The same sampling frame was used for both periods. For both the pretest and posttest, the calculated sample size resulted in 24 weekly production periods. Detailed calculations are available in Figure 1. Also, simple random sampling was used.
|
|
||
|
Sampling frame |
N = |
40 |
|
Alpha (Maximum type I error) |
α = |
5% |
|
Confidence level |
1− ɑ/2 = |
0.98 |
|
Z (1-α/2) |
Z (1− ɑ/2) = |
1.96 |
|
Standard deviation |
s = |
0.19 |
|
Variance |
s2 = |
0.0361 |
|
Precision or margin of error |
d = |
0.05 |
|
Size |
n = |
24 |
Figure 1. Calculation of pretest and posttest sample size.
Source: Prepared by the authors.
Baseline Identification and Diagnosis of the Current Situation
The manufacturing cell was conceived and applied according to the following phases:
a) A Pareto analysis of the different product lines of the company was carried out, taking into consideration the annual revenue generated in 2020. This analysis revealed that the shrimp feed product line contributed 59.9% of the total revenues of all lines, which justified focusing efforts on this specific line to begin the implementation of manufacturing cells.
b) A product-process matrix was prepared, and the company’s extruded shrimp feed product line was analyzed using the simple visualization method, which allowed for the identification of two family groups. The first family, which was chosen for this investigation, comprises five products that share batch assembly, mixing, pre-grinding, fine grinding, extrusion, drying, coating, and packaging. The second family comprises five products, but it was disregarded since they do not share the pre-grinding process.
c) According to Miño et al. (2019), the takt time derives from the German taktzeit and establishes the rhythm needed to meet the market demand. It was calculated to design the manufacturing cells. The total available time in a working day of the company (81 000 seconds per day) was divided by the daily demand of the product family (25.96 tons per day). The result was 3120 seconds per ton. This made it possible to establish the production rate when implementing the cells.
d) Subsequently, the current value stream map was developed using Value Stream Mapping (VSM). VSM is a simple and cost-effective tool for diagnosing problems related to production processes. It allows visualizing and understanding processes and distinguishing between value and waste. Figure 2 shows that the total value-added time is 20 040 seconds. However, the total production lead time —the time that does not add value plus the time that does add value, from when the manufacturing order is received on the factory floor until the finished product is obtained— is 4.61 days plus 20 040 seconds, resulting in a total of 418 344 seconds. Therefore, the current cycle time efficiency is 0.04790 (resulting from 20 040 / 418 344). Figure 2 also shows that the coating and extrusion processes generate a greater accumulation of work in progress, with lead times of 1.30 and 0.78 days respectively. The map of the current situation has 8 stations, each one operated by one worker, thus requiring a total of 8 collaborators.
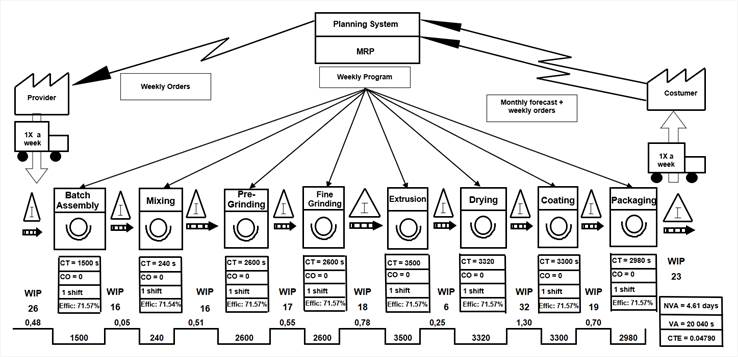
Figure 2. Overview of the pretest situation of the extruded feed manufacturing system using VSM.
Source: Prepared by the authors.
e) The current available production capacity was calculated by dividing the available time per day (81 000 seconds per day) by the cycle time of the extrusion process, which is the current bottleneck (3500 seconds per ton). This operation resulted in an available capacity of 23.14 tons per day. This capacity is lower than the required market demand (25.96 tons per day). The current efficiency of the production process was also recorded by accumulating the process cycle times (20 040 seconds) and dividing the result by the number of workstations multiplied by the bottleneck cycle time (8 workstations * 3500 seconds); resulting in an efficiency of 71.57%. These calculations allowed identifying areas for improvement and implementing strategies to dilute the bottleneck and improve operational efficiency.
f) An Operation Balance Chart (OBC) was performed, which, according to the Lean Enterprise Institute (2014), is a graphical representation that helps to create a continuous flow in a process with multiple stages and operators. Govender and Dewa (2022) state that this diagram allows to identify the processes that require improvement and redistribute the tasks in order to achieve the takt time. Figure 3 shows the current overloads of the extrusion, drying, and coating processes compared to the takt time.
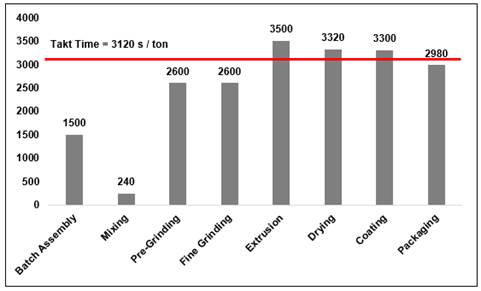
Figure 3. Operation balance chart for the current extruded feed production system.
Source: Prepared by the authors.
g) Table 1 shows the collected data from the pretest in which current downtime was recorded. This initial data collection will contribute to validating the hypothesis.
Table 1. Current Downtime (Results Before Improvement).
|
Period (Weeks) |
A |
B |
C |
D |
E |
Downtime (D - E) (sec/ton) |
|
Number of Stations |
Available Time (sec) |
Production (ton) |
A * (B / C) (sec/ton) |
Value-adding Process Time (sec/ton) |
||
|
P1 |
8 |
486 000 |
135 |
28 800 |
20 040 |
8760 |
|
P2 |
8 |
486 000 |
147 |
26 449 |
20 040 |
6409 |
|
P3 |
8 |
486 000 |
147 |
26 449 |
20 040 |
6409 |
|
P4 |
8 |
486 000 |
147 |
26 449 |
20 040 |
6409 |
|
P5 |
8 |
486 000 |
135 |
28 800 |
20 040 |
8760 |
|
P6 |
8 |
486 000 |
135 |
28 800 |
20 040 |
8760 |
|
P7 |
8 |
486 000 |
153 |
25 412 |
20 040 |
5372 |
|
P8 |
8 |
486 000 |
159 |
24 453 |
20 040 |
4413 |
|
P9 |
8 |
486 000 |
132 |
29 455 |
20 040 |
9415 |
|
P10 |
8 |
486 000 |
147 |
26 449 |
20 040 |
6409 |
|
P11 |
8 |
486 000 |
150 |
25 920 |
20 040 |
5880 |
|
P12 |
8 |
486 000 |
156 |
24 923 |
20 040 |
4883 |
|
P13 |
8 |
486 000 |
131 |
29 589 |
20 040 |
9549 |
|
P14 |
8 |
486 000 |
152 |
25 512 |
20 040 |
5472 |
|
P15 |
8 |
486 000 |
137 |
28 421 |
20 040 |
8381 |
|
P16 |
8 |
486 000 |
161 |
24 179 |
20 040 |
4139 |
|
P17 |
8 |
486 000 |
141 |
27 574 |
20 040 |
7534 |
|
P18 |
8 |
486 000 |
149 |
26 094 |
20 040 |
6054 |
|
P19 |
8 |
486 000 |
140 |
27 771 |
20 040 |
7731 |
|
P20 |
8 |
486 000 |
158 |
24 608 |
20 040 |
4568 |
|
P21 |
8 |
486 000 |
133 |
29 233 |
20 040 |
9193 |
|
P22 |
8 |
486 000 |
152 |
25 512 |
20 040 |
5472 |
|
P23 |
8 |
486 000 |
138 |
28 174 |
20 040 |
8134 |
|
P24 |
8 |
486 000 |
160 |
24 300 |
20 040 |
4260 |
Source: The data shown in Table 1 was calculated, processed, and collected by the authors for this study.
Note: The last column of Table 1 will serve to validate the hypothesis.
h) An activity diagram (see Figure 4) was created to comprehend and analyze the workflow in depth and detect potential deficiencies. This diagram consists of ten operations, nine inspections, five transportations, two delays, and two storages. The total time needed to complete the entire process is 357.90 minutes, and a total distance of 209 meters is covered.
Elaboration and Implementation of Improvement Strategies and Visualization of the Future State
a) After thoroughly evaluating the task and responsibility distribution in the process, a workload reassignment was carried out to enhance the flow and eliminate the bottleneck. As part of this initiative, the collaborators were trained with the objective of improving their performance. The outcome is shown in Figure 5.
b) Non-value-adding activities were identified and reduced through work method improvements and the elimination of unnecessary steps (see Figure 6). One of the eliminated activities was the product inspection after drying, as it was determined unnecessary since the moisture could be verified upon waiting for the corresponding results. Additionally, the batch recipe review was eliminated, as comprehensive formula audits were conducted to ensure accuracy. These actions contributed to improving efficiency and eliminating redundant activities in the process, as shown in Figure 6.
The improved process now consists of nine operations, five inspections, five transportations, two delays, and two storages. Consequently, the total process time is now 154.90 minutes, and a total distance of 105 meters is covered.
c) The configuration of a serpentine cell that encompassed the batch assembly, mixing, pre-grinding, fine grinding, extrusion, drying, coating or cooling, and packaging processes was proposed. This cell required a total of four stations and nine workers, distributed as follows: one worker in the first station, two in the second, three in the third, and three more in the fourth station (see Figure 7). With the new workload distribution and the addition of resources, downtime was reduced. As shown in the improved value stream map (see Figure 7), the total value-added time is 8707 seconds, and the non-value-added time is 1.26 days, equivalent to 108 864 seconds. Thus, the new cycle time efficiency is 0.073896, resulting from solving the following arithmetic expression: 8707 / (8707 + 108 864).
d) Since the new bottleneck shifted to the pre-griding and fine-grinding process, the calculation of available production capacity was updated by dividing the available time per day (81 000 seconds per day) by the cycle time of the new bottleneck (2600 seconds per ton). This operation resulted in an available capacity of 31.15 tons per day. Therefore, the available capacity became greater than the available capacity required by the market (25.96 tons per day). The improved efficiency of the production process was also recorded by adding the new process cycle times (8707 seconds) and dividing the result by the number of workstations multiplied by the cycle time of the new bottleneck (4 positions*2600 seconds). The result is an efficiency of 83.72%.
e) Table 2 shows the data collected in the posttest phase, that is to say, the magnitude of the downtimes after the implementation of cellular manufacturing. This second round of data will allow to validate the hypothesis.
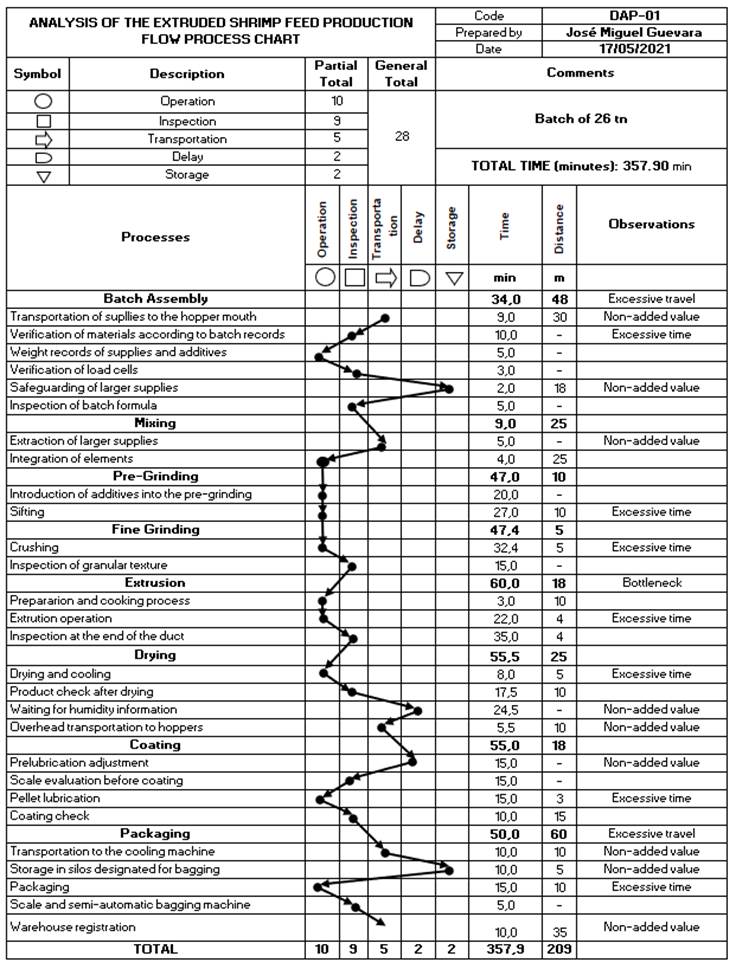
Figure 4. Flow process chart before improvement.
Source: Prepared by the authors.
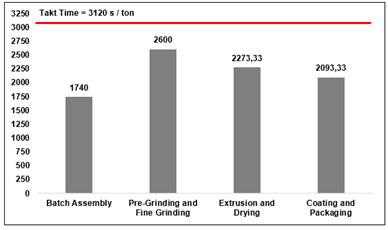
Figure 5. Improved operation balance chart for the extruded feed production process.
Source: Prepared by the authors.
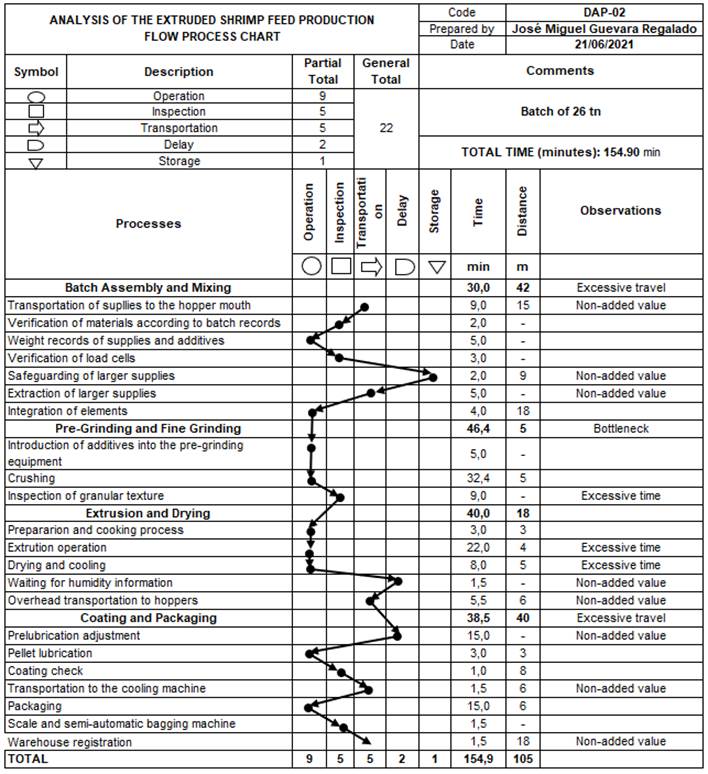
Figure 6. Flow process chart after improvement.
Source: Prepared by the authors.
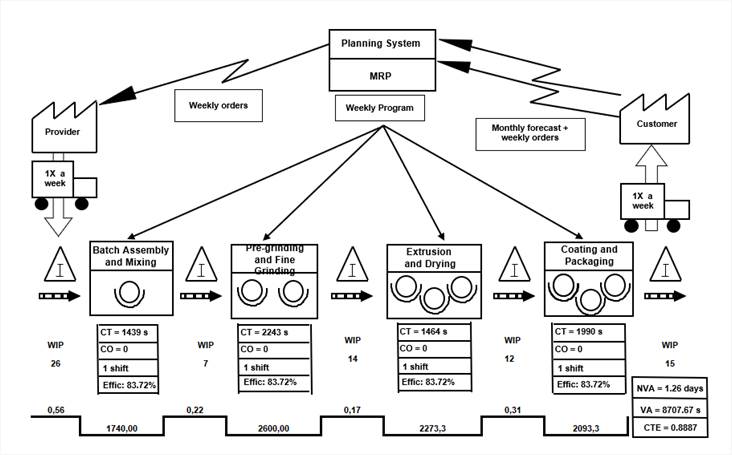
Figure 7. Overview of the posttest situation of the extruded feed manufacturing system using VSM.
Source: Prepared by the authors.
Table 2. Improved Downtime (Results After Improvement).
|
Period (weeks) |
A |
B |
C |
D |
E |
Downtime (D - E) (sec/ton) |
|
Number of Stations |
Available Time (sec) |
Production (ton) |
A * (B / C) (sec/ton) |
Value-Adding Process Time (sec/ton) |
||
|
P1 |
4 |
486 000 |
155 |
12 542 |
8707.67 |
3834 |
|
P2 |
4 |
486 000 |
165 |
11 782 |
8707.67 |
3074 |
|
P3 |
4 |
486 000 |
167 |
11 641 |
8707.67 |
2933 |
|
P4 |
4 |
486 000 |
169 |
11 503 |
8707.67 |
2795 |
|
P5 |
4 |
486 000 |
161 |
12 075 |
8707.67 |
3367 |
|
P6 |
4 |
486 000 |
171 |
11 368 |
8707.67 |
2661 |
|
P7 |
4 |
486 000 |
183 |
10 623 |
8707.67 |
1915 |
|
P8 |
4 |
486 000 |
185 |
10 508 |
8707.67 |
1800 |
|
P9 |
4 |
486 000 |
161 |
12 075 |
8707.67 |
3367 |
|
P10 |
4 |
486 000 |
171 |
11 368 |
8707.67 |
2661 |
|
P11 |
4 |
486 000 |
183 |
10 623 |
8707.67 |
1915 |
|
P12 |
4 |
486 000 |
185 |
10 508 |
8707.67 |
1800 |
|
P13 |
4 |
486 000 |
169 |
11 503 |
8707.67 |
2795 |
|
P14 |
4 |
486 000 |
179 |
10 860 |
8707.67 |
2153 |
|
P15 |
4 |
486 000 |
183 |
10 623 |
8707.67 |
1915 |
|
P16 |
4 |
486 000 |
185 |
10 508 |
8707.67 |
1800 |
|
P17 |
4 |
486 000 |
167 |
11 613 |
8707.67 |
2905 |
|
P18 |
4 |
486 000 |
173 |
11 250 |
8707.67 |
2542 |
|
P19 |
4 |
486 000 |
187 |
10 401 |
8707.67 |
1694 |
|
P20 |
4 |
486 000 |
190 |
10 253 |
8707.67 |
1545 |
|
P21 |
4 |
486 000 |
175 |
11 096 |
8707.67 |
2388 |
|
P22 |
4 |
486 000 |
178 |
10 909 |
8707.67 |
2201 |
|
P23 |
4 |
486 000 |
184 |
10 554 |
8707.67 |
1846 |
|
P24 |
4 |
486 000 |
187 |
10 401 |
8707.67 |
1694 |
Note: The last column of Table 2 will serve to validate the hypothesis.
RESULTS
Performance Indicators of the Proposed Cell Versus the Previous Production Line
Table 3 presents and consolidates the previously calculated results, highlighting quantitatively the percentage improvement in each listed indicator.
Despite the need to add a new operator to balance workloads and adjust the cycle time to takt time, the design of the new manufacturing cell achieved economic benefits. This is because the 54.03% improvement in cycle time efficiency allowed for reduced production time, resulting in decreased labor and energy costs.
The 34.60% increase in available production capacity also allowed the company to produce more without incurring additional costs. The 30.61% reduction in time per ton and the 25.68% reduction in labor cost per ton resulted in decreased labor costs. Meanwhile, the 49.76% reduction in distance traveled resulted in transportation costs and equipment maintenance savings.
The indicators shown in Table 3 also contribute to leveraging profit margins, as increased production capacity allows the company to offer a greater quantity of products and/or expand its markets, leading to increased revenue from sales. The 16.99% improvement in line efficiency versus the designed cell indicates a more effective utilization of resources. This enhances competitiveness in the market and improves customer satisfaction by meeting delivery deadlines. Lastly, the 50% reduction in the number of required stations enables a reduction in operating costs and an improvement in asset utilization.
Table 3. Summary of Achievements Following the Design and Implementation of the Manufacturing Cell.
|
Indicator |
Initial State |
Improved State |
Difference |
Percentage Improvement |
|
Cycle time efficiency |
0.0479 |
0.0738 |
0.0259 |
54.03% |
|
Available production capacity |
23.14 ton/day |
31.15 ton/day |
8.01 ton/day |
34.60% |
|
Initial line efficiency versus designed cell efficiency |
71.57% |
83.72% |
12.15% |
16.99% |
|
Distance traveled |
209 m |
105 m |
104 m |
−49.76% |
|
Number of required stations |
8 |
4 |
−4 |
−50% |
|
Number of operators |
8 |
9 |
1 |
12.50% |
|
Time in hours per ton produced |
0.98 h/ton |
0.68 h/ton |
0.3 h/ton |
−30.61% |
|
Labor rate per ton unit |
S/ 9.19/ton |
S/ 6.83/ton |
S/ 2.36/ton |
−25.68% |
Source: Prepared by the authors.
Data Normality Test
First, an analysis was performed to determine whether the downtime variable (before and after the implementation of the manufacturing cell) follows a normal distribution. Data were collected from the last columns of Tables 1 and 2.
There were two hypotheses:
H0: The random variable downtime does have a normal distribution.
H1: The random variable downtime does not have a normal distribution.
A significance level of 5% was considered and the Shapiro-Wilk test was applied because the sample size is 24 events. The data were processed using the IBM-SPSS-Statistics 22 package.
The results showed that there is sufficient evidence to affirm that the distribution of the random variable downtime is different from the normal distribution since the significance values obtained (p-value = 0.011) were lower than the established significance level (see Table 4).
Table 4. Normality Test.
|
|
Kolmogorov-Smirnova |
Shapiro-Wilk |
||||
|
Statistic |
df |
Sig. |
Statistic |
df |
Sig. |
|
|
Pretest-Posttest |
0.203 |
24 |
0.012 |
0.886 |
24 |
0.011 |
|
a. Lilliefors Significance Correction |
||||||
Source: Results obtained in SPSS Statistics 22 version.
Application of the Wilcoxon Test for Related Samples
A statistical analysis was performed using the nonparametric Wilcoxon test to evaluate the research hypothesis. It was investigated whether there is a significant difference in the downtime before and after the implementation of the manufacturing cell, in other words, whether the mean of the differences of the downtime is equal to zero.
The data were collected from the last columns of Tables 1 and 2.
The hypotheses were:
H0: There is no significant difference in the downtime before and after the implementation of the manufacturing cell.
H1: There is a significant difference in the downtime before and after the implementation of the manufacturing cell.
The significance level was 5%.
The results obtained by SPSS
are shown in Table 5 and allow us to affirm that there are statistically
significant differences in downtime, being the pretest scores (![]() higher than the
posttest scores (
higher than the
posttest scores (![]() , Z = −4.286, p <
0.000018, Hedges’s g = 3.47.
, Z = −4.286, p <
0.000018, Hedges’s g = 3.47.
Table 5. Summary of the Results Obtained.
|
|
Pretest |
Posttest |
Z |
p |
Hedges’s g |
||
|
Mean |
Range |
Mean |
Range |
||||
|
Downtime (seconds per ton) |
6 765.25 |
5410 |
2400 |
2289 |
−4.286 |
0.000018 |
3.47 |
Source: Information consolidated from calculations performed using IBM-SPSS-Statistics 22.
DISCUSSION
It is concluded that the downtime before the implementation of the independent variable in this study was significantly higher, with a mean of 6765.25 seconds per ton and a range of 5410 seconds per ton. However, after implementing the manufacturing cell, the mean decreased to 2400 seconds per ton, with a range of 2289 seconds per ton.
Additionally, the Hedges' g value reinforces the analysis, as it allows for the evaluation of the effect size of the difference between the means of downtime before and after implementing the new resource distribution. The obtained g value = 3.47 suggests a moderate to large effect size, indicating a significant difference between the downtime in both situations.
At the same time, as consolidated in Table 3, the research findings support and corroborate previous studies by Junior et al. (2019) regarding efficiency improvement. It is particularly observed that the cycle time efficiency was initially 0.0479, and with the serpentine cell, it became 0.0738, representing a 54.03% reduction. Furthermore, the efficiency of the conventional line compared to the proposed cell improved by 16.99%. This not only contributes to increasing productivity but also reduces direct operating costs and storage costs by accelerating the manufacturing process, allowing inventories to flow along the value chain, thus reducing cost impacts.
Identifying and eliminating non-value-added activities through process improvement reduced traveled distances from 209 to 105 meters, achieving a 49.76% improvement. Moreover, by properly balancing the loads of the stations forming the manufacturing cell, direct costs were reduced, similar to the findings of Gayathri et al. (2018). Specifically, the labor rate per ton decreased from S/ 9.19 to S/ 6.33, achieving a 25.68% reduction.
Unlike the approach proposed by Pantoja et al. (2017), the simple visualization method was chosen to define the product family, confirming the feasibility of the improvement associated with a Peruvian company.
Following the recommendations of Rafiee and Mohamaditalab (2020), the cell’s design considered employee capacities and versatility.
Similar to Suganthini et al. (2017), it was proven that the bottleneck shifted and the available production capacity improved by 34.60% (from 23 tons/day to 31.15 tons/day) through shojinka. Lastly, production time decreased from 0.98 hours/ton to 0.68 hours/ton, representing a 30.61% reduction.
CONCLUSIONS
The implementation of the manufacturing cell has proven highly effective in reducing downtimes in the process under study. A significant decrease in downtime was observed, from a mean of 6765.25 sec/ton to a mean of 2400 sec/ton, indicating a 64.52% process efficiency improvement.
The results support previous research and highlight the importance of adopting factory layout improvement strategies to achieve higher productivity, reduce operating costs, and enhance business competitiveness. It is encouraged that aquaculture companies consider this approach as a viable option to improve their process flow and resource performance.
Furthermore, to support and/or further enhance the improvement over time, it is recommended to apply other lean tools such as SMED, standard work, TPM, etc., and to promote personnel training and development to adapt to the changes implemented in the manufacturing cell.
Lastly, it is advisable for universities to use this case as a reference to train and develop lean manufacturing skills in future industrial engineers.
REFERENCES
[1] Baysan, S., Kabadurmus, O., Cevikcan, E., Satoglu, S. I., & Durmusoglu, M. B. (2019). A simulation-based methodology for the analysis of the effect of lean tools on energy efficiency: An application in power distribution industry. Journal of Cleaner Production, 211, 895-908. https://doi.org/10.1016/J.JCLEPRO.2018.11.217
[2] Benders, J., & Badham, R. (2000). History of Cell-Based Manufacturing. In M. Beyerlein (Ed.), Work Teams: Past, Present and Future (pp. 45-57). Springer Dordrecht. https://doi.org/10.1007/978-94-015-9492-9_3
[3] Borges, S., Odila, J., Voss, G., Martins, R., Rosa, A., Couto, J. A., Almeida, A., & Pintado, M. (2023). Fish By-Products: A Source of Enzymes to Generate Circular Bioactive Hydrolysates. Molecules, 28(3), 1155. https://doi.org/10.3390/molecules28031155
[4] Chiarini, A. (2014). Sustainable manufacturing-greening processes using specific Lean Production tools: an empirical observation from European motorcycle component manufacturers. Journal of Cleaner Production, 85, 226-233. https://doi.org/10.1016/J.JCLEPRO.2014.07.080
[5] Forghani, K., Fatemi, G., & Kia, R. (2021). Group layout design of manufacturing cells incorporating assembly and energy aspects. Engineering Optimization, 54(5), 770-785. https://doi.org/10.1080/0305215X.2021.1900155
[6] Gayathri, N., Karthick, N., Shanmuganathan, V. K., Adhithyan, T. R., Madhan Kumar, T., & Gopalakrishnan, J. (2018). Productivity Improvement and Cost Reduction in Hydraulic Cylinders. International Journal of Engineering and Technology, 7(3.34), 382-384. https://doi.org/10.14419/IJET.V7I3.34.19232
[7] Govender, P., & Dewa, M. (2022). Use of Kaizen Principle and Line Balancing Technique for Process Improvement in the Assembly of Automotive Components. South African Journal of Industrial Engineering, 33(3), 69-82. https://doi.org/10.7166/33-3-2790
[8] Guélac-Gómez, J., Sánchez-Calle, J. E., & Valles-Coral, M. A. (2023). Impacto del uso de herramientas tecnológicas en la producción acuícola. Enfoque UTE, 14(2), 66-76. https://doi.org/10.29019/ENFOQUEUTE.894
[9] Hales, L., & Anersen, B. (2002). Planning Manufacturing Cells. Society of Manufacturing Engineers.
[10] Junior, C. D., Espíndola Ferreira, J. C., Henning, E., & Pereira, C. R. (2019). Assessment of shop floor layouts in the context of process plans with alternatives. Production, 29. https://doi.org/10.1590/0103-6513.20180078
[11] Lean Enterprise Institute. (2014). Lean Lexicon (5th ed.). New York, NY, U.S.: Lean Enterprise Institute, Inc.
[12] Liker, J., & Meier, D. (2006). The Toyota Way Fieldbook. New York, NY, U.S.: McGraw Hill.
[13] Miño Cascante, G., Moyano Alulema, J., & Santillán Mariño, C. (2019). Tiempos estándar para balanceo de línea en área soldadura del automóvil modelo cuatro. Ingeniería Industrial, 40(2).
[14] Organización de las Naciones Unidas para la Alimentación y la Agricultura. (2022). El estado mundial de la pesca y la acuicultura 2022. https://doi.org/10.4060/CC0461ES
[15] Pantoja, C., Orejuela, J. P., & Bravo, J. J. (2017). Metodología de distribución de plantas en ambientes de agrupación celular. Estudios Gerenciales, 33(143), 132-140.
[16] Rafiee, M., & Mohamaditalab, A. (2020). Investigation into skill leveled operators in a multi-period cellular manufacturing system with the existence of multi-functional machines. Scientia Iranica, 27(6), 3219-3232. https://doi.org/10.24200/sci.2019.21513
[17] Ramesh, S., Arunkumar, N., & Vijayaraj, R. (2021). Cellular manufacturing layout design using heuristic clustering algorithm and LPP model. The South African Journal of Industrial Engineering, 32(2), 1-16. https://doi.org/10.7166/32-2-2340
[18] Renna, P., Materi, S., & Ambrico, M. (2023). Review of Responsiveness and Sustainable Concepts in Cellular Manufacturing Systems. Applied Sciences, 13(2), 1125. https://doi.org/10.3390/APP13021125
[19] Research and Markets. (2021, May 6). Análisis del Mercado de Alimentos Acuícolas hasta el 2026. International Aquafeed. https://aquafeed.co/entrada/analisis-del-mercado-de-alimentos-acuicolas-hasta-el-2026-24765
[20] Rother, M., & Harris, R. (2001). Creating Continuous Flow : An Action Guide for Managers, Engineers & Production Associates (1st ed.). Cambridge, MA, U.S.: Lean Enterprise Institute.
[21] Salimbeni Gandino, S., & Mamani, D. (2020). Marco de referencia para la incorporación de Cobots en líneas de manufactura. Podium, (38), 159-180. https://doi.org/10.31095/PODIUM.2020.38.10
[22] Suganthini, R., Periyasamy, P., & Nallusamy, S. (2017). Manufacturing Enhancement through Reduction of Cycle Time using Different Lean Techniques. IOP Conference Series: Materials Science and Engineering, 225(1), 012282. https://doi.org/10.1088/1757-899X/225/1/012282
[23] Vargas-Hernández, J. G., Jiménez Castillo, M. T., & Muratalla-Bautista, G. (2018). Sistemas de producción competitivos mediante la implementación de la herramienta Lean Manufacturing. Revista Digital Ciencias Administrativas, (11). https://doi.org/10.24215/23143738e020
[24] Wemmerlöv, U., & Johnson, D. J. (2010). Cellular manufacturing at 46 user plants: Implementation experiences and performance improvements. International Journal of Production Research, 35(1), 29-49. https://doi.org/10.1080/002075497195966
[25] Zhao, Y., Lu, J., & Yi, W. (2020). A new cellular manufacturing layout: Multi-floor linear cellular manufacturing layout. International Journal of Advanced Robotic Systems, 17(3). https://doi.org/10.1177/1729881420925300