Revista Industrial Data 27(1): 251-277 (2024)
DOI: https://doi.org/10.15381/idata.v27i1.25643
ISSN: 1560-9146 (Impreso) / ISSN: 1810-9993 (Electrónico)
Increased Productivity of a Garment Manufacturing Company Using 5S
Joe Alexis González Vasquez [1]
Ingrid Jasmín Bocanegra Quiñones [2]
Ángel Aarom Ruiz Díaz [3]
Jerson Waldir Obando Mantilla [4]
Elmer Tello de la Cruz [5]
Santos Santiago Javez Valladares [6]
Production and Management
Submitted: 13/09/2023 Accepted: 01/12/2023 Published: 02/09/2024
DOI: https://doi.org/10.15381/idata.v27i1.26152.g204481
ABSTRACT
Keywords: productivity, 5S methodology, lean manufacturing.
INTRODUCTION
The 5S methodology is a set of Japanese processes that aim to eliminate unnecessary items, organize essentials, maintain a clean and orderly space, standardize processes, and ensure long-term sustainability (Makwana & Patange, 2022). This tool is widely used to optimize processes, improve productivity and quality, and encourage employee participation in continuously improving their work environment (Goswami et al., 2019). It is important to note that 5S is an industrial practice that can differentiate a company from others.
By applying the 5S methodology, the company can create a safe and healthy work environment that ensures compliance with standards and fosters quality improvement (Randhawa & Ahuja, 2018). The lack of a proper 5S system can render other lean tools ineffective (Zadry & Darwin, 2020). Regardless of the environment in which 5S is implemented, the primary focus of researchers has always been to ensure that the process is efficient and devoid of undetected waste in a manufacturing operation (Jaca et al., 2014).
According to data from the Ministry of Production (Ministerio de la Producción, 2022), the textile and apparel sector’s gross domestic product (GDP) experienced an annual decline of 5.2% from 2011 to 2020, which worsened in 2020 with a 31.8% drop due to the impact of the COVID-19 pandemic. This situation has particularly affected microenterprises, which make up 95.0% of the sector. Currently, the textile industry is recovering from the effects of the pandemic and is facing increasing competition. Therefore, according to Shahriar et al. (2022), companies should implement strategies to maintain their competitiveness, which involves improving quality and optimizing production by eliminating tasks that do not benefit the process or the customer.
A study conducted by Vargas and Camero (2022) investigated the persistently low productivity in the production area of aqueous adhesives in a manufacturing company. The productivity had been below 5 kg/MH for four years, which was lower than the expected target. To address this issue, they decided to use the lean manufacturing methodology, specifically the 5S methodology. The application of 5S resulted in an increase in average productivity to 5.58 kg/MH, compared to 4.37 kg/MH in 2018, before the implementation of lean manufacturing. Similarly, Chilón et al. (2017) applied 5S to improve productivity in a water bottling plant, which led to a 29% increase in the production of ozonated water, from 103.41 to 133.39 liters per hour. These results highlight the positive impact of 5S on production efficiency.
In the present case, the textile industry company is starting its lean adoption process using 5S as its starting point, as mentioned by Veres et al. (2018). This is because lean manufacturing and the 5S methodology are closely related. Then, 5S is considered an integral tool within the lean approach, designed to eliminate waste, which is a central tenet of Lean, and to establish a highly productive and well-organized work environment (Srinivasan et al., 2016). Incorporating 5S is perceived as the first step in the adoption of the lean philosophy, as it lays the foundation for constant improvement and increased production efficiency.
This study aims to investigate the application of the 5S methodology in the T-shirt manufacturing industry, which is representative of small and medium-sized enterprises (SMEs) in Trujillo. To compete in the global market, SMEs need to improve their efficiency and productivity. The research hypothesizes that applying 5S will lead to a noticeable improvement in productivity in the Production Department of the company.
This research is noteworthy for its innovative and relevant nature, as only a few studies have focused on the implementation of 5S in SMEs. Companies in the textile and apparel industry are particularly interested in improving their productivity to remain competitive. The 5S methodology is a central focus for improving production by eliminating waste, optimizing processes, and promoting a clean and safe work environment. This results in more efficient and higher-quality production, which are crucial factors to compete and consolidate as a company in the global textile industry.
Lean Manufacturing
Lean manufacturing is a strategy that aims to eliminate waste in production to achieve greater efficiency and quality. Its principles include eliminating non-valuable activities, managing customer value, continuous workflow, just-in-time production, continuous improvement, and respect for people (Guzel & Asiabi, 2022).
According to Abu et al. (2019), 5S is an integral part of lean manufacturing as it focuses on eliminating waste through organization, cleanliness, and standardization of processes. This improves efficiency and productivity by reducing wasted time and creating an efficient and safe work environment. Both lean manufacturing and 5S share a focus on continuous improvement.
5S Methodology
Jiménez et al. (2015) explain that 5S is a management and structuring methodology that originated in Japan. It is designed to optimize efficiency and productivity in the workplace. The name “5S” comes from five Japanese words that begin with the letter “S”, representing the five fundamental principles of this philosophy:
· Seiri (sort) involves identifying materials and equipment that are unnecessary or underutilized in the workplace, avoiding disorganization and loss of efficiency.
· Seiton (straighten) involves appropriately organizing cluttered items to reduce searching and prevent errors.
· Seiso (shine) involves setting up cleaning procedures and frequency that everyone follows, preventing dirt that affects production and risks of accidents.
· Seiketsu (standardization) involves establishing clear visual guidelines that are highly communicative and easy to understand for an orderly and clean workplace.
· Shitsuke (sustain) involves maintaining the 5S practices constantly, promoting a culture of continuous improvement and a proactive attitude towards organization and efficiency in the work environment.
Productivity
Palange and Dhatrak (2021) define productivity as the ratio between production and the use of resources. They emphasize that productivity is crucial in any process as it ensures the agility and adaptability of an organization. Hanif et al. (2018) explain that productivity is linked to the effectiveness of using available resources to achieve specific goals. They also suggest that assessing a company’s productivity is crucial to identifying issues and developing strategies to tackle them.
The measurement of revenue productivity versus costs is a way to determine the efficiency of generating value compared to production expenses. A high level of productivity indicates efficiency and profitability, while a low level suggests a need to improve efficiency or reduce costs to increase profitability.
![]()
METHODOLOGY
The purpose is to analyze the current state of production and identify any elements that may be negatively affecting productivity levels.
To this end, we created a flow process chart, which provides a visual representation of all the stages and tasks involved in the manufacturing process. This helps to identify areas where inefficiencies, bottlenecks, and inadequate resource allocation could arise. Additionally, it plays a crucial role in promoting continuous improvement and ensuring compliance with industry regulations (Achibat et al., 2023).
The Ishikawa diagram technique was used to identify the root causes of production problems, rather than just addressing the symptoms. This thorough evaluation was essential to effectively address the issues (Hossen et al., 2017). To prioritize the problems, we also used the Pareto chart to identify the most recurrent ones.
Additionally, we initially assessed the degree of 5S adoption in the company using a data recording sheet. Participants rated each criterion on a scale of 0 to 4, with 0 being “unsatisfactory”, 1 being “needs improvement”, 2 being “acceptable”, 3 being “good”, and 4 being “excellent”. Using the 5S evaluation matrix, the results were displayed graphically, as recommended by Huánuco and Rosales (2018).
Before implementing 5S in production, efficiency, effectiveness, and productivity indicators were assessed. This provided an objective benchmark to measure current performance and track progress over time.
The second purpose is to implement the 5S methodology in production, which involves evaluating each phase of the process as follows:
· During the Seiri (sort) stage, all elements in the Production Department are categorized. The categories are materials and inputs (MI), raw material (RM), products in process (PP), finished products (FP), tools (T), and machines and equipment (ME).
· Regarding Seiton (straighten), the frequency of use of elements in production was evaluated. Items used daily are kept in the work area, those used weekly are placed near the work area, those used monthly are stored on shelves, and those used every six months are stored elsewhere.
· Regarding Seiso (shine), subareas are evaluated based on their degree of cleanliness, covering categories such as clean areas, poorly cleaned areas, and very dirty areas. The degree of compliance with the proposed cleaning program in the manufacturing area was confirmed.
· In the Seiketsu (standardization) and Shitsuke (sustain) stages, evaluations were conducted using a scale that includes percentages ranging from 25% for “unsatisfactory”, through 50% for “acceptable”, 75% for “good”, to 100% for “excellent”.
For the third purpose, an exhaustive analysis was conducted to evaluate whether the improvements achieved maximum optimization of resources, such as labor, machinery, raw materials, and time. The analysis focused on the efficiency, effectiveness, and productivity indicators. To conclude, a final evaluation was carried out to determine the level of 5S adoption in the company using a data verification sheet.
RESULTS
Current State of the Production Department of the Company
A flow process chart was used to perform a detailed examination of the company’s production process, as shown in Figure 1.
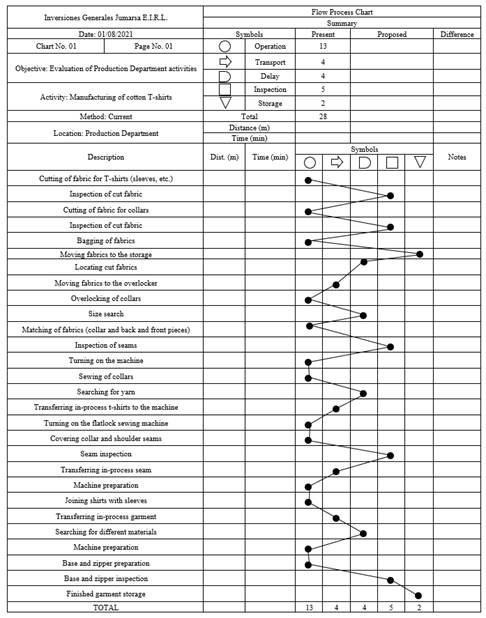
Figure 1. Flow process chart used to illustrate the manufacturing process of the company.
Source: Prepared by the authors.
The Ishikawa diagram was then used to identify the root causes and explore the potential relationships between various factors that affect the company’s productivity, as shown in Figure 2.
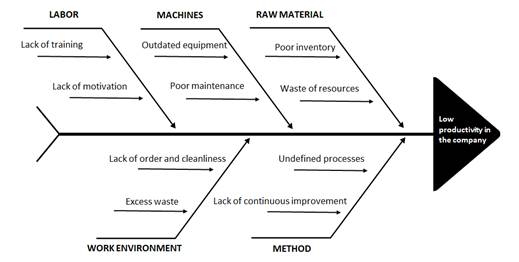
Figure 2. Ishikawa diagram to analyze low productivity in the company.
Source: Prepared by the authors.
Table 1. Frequency of Factors Contributing to Low Productivity in the Company.
|
Root Cause |
Description |
fi |
hi |
Hi |
80-20 |
|
CR1 |
Lack of order and cleanliness |
60 |
32.6% |
32.6% |
80 |
|
CR2 |
Undefined processes |
45 |
24.5% |
57.1% |
80 |
|
CR3 |
Poor inventory |
24 |
13.0% |
70.1% |
80 |
|
CR4 |
Lack of training |
21 |
11.4% |
81.5% |
80 |
|
CR5 |
Waste of resources |
15 |
8.2% |
89.7% |
20 |
|
CR6 |
Lack of motivation |
7 |
3.8% |
93.5% |
20 |
|
CR7 |
Lack of continuous improvement |
5 |
2.7% |
96.2% |
20 |
|
CR8 |
Poor maintenance |
3 |
1.6% |
97.8% |
20 |
|
CR9 |
Excess waste |
3 |
1.6% |
99.5% |
20 |
|
CR10 |
Outdated equipment |
1 |
0.5% |
100.0% |
20 |
Source: Prepared by the authors.
According to the Pareto chart, 81.5% of the problems in the company are linked to reduced productivity, as illustrated in Figure 3.
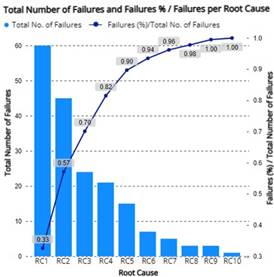
Figure 3. Pareto chart to analyze low productivity in the company.
Source: Prepared by the authors.
Table 2. Level of Adoption of the 5S in the Company Before the Implementation of Improvements.
|
Stage |
Item |
Evaluation Criteria |
0 |
1 |
2 |
3 |
4 |
Total |
|
Sort |
1 |
There are only essential items, equipment, and tools in the manufacturing area. |
|
|
x |
|
|
10 |
|
2 |
There are only essential equipment and tools in the manufacturing area. |
|
|
|
x |
|
||
|
3 |
There are sufficient raw materials in the manufacturing area. |
|
|
x |
|
|
||
|
4 |
There are cleaning standards in place in the manufacturing area. |
|
x |
|
|
|
||
|
5 |
There is visual control of processes in the manufacturing area. |
|
|
x |
|
|
||
|
Straighten |
6 |
Items are easily accessible in the manufacturing area. |
|
|
x |
|
|
7 |
|
7 |
Machines are properly located in the manufacturing area. |
|
x |
|
|
|
||
|
8 |
There are designated spaces for storing tools in the manufacturing area. |
|
x |
|
|
|
||
|
9 |
Transit ailes in the manufacturing area are clearly marked. |
|
x |
|
|
|
||
|
10 |
The manufacturing area operates at maximum production capacity. |
|
|
x |
|
|
||
|
Shine |
11 |
Transit ailes in the manufacturing area are cleaned and without any waste. |
|
x |
|
|
|
9 |
|
12 |
There are designated personnel responsible for maintaining cleanliness. |
|
x |
|
|
|
||
|
13 |
The machines and equipment in the manufacturing area are kept in good condition. |
|
|
x |
|
|
||
|
14 |
The manufacturing area is cleaned whenever it is needed. |
|
|
x |
|
|
||
|
15 |
There are adequate waste containers in the manufacturing area. |
|
|
|
x |
|
||
|
Standardization |
16 |
There are set rules and procedures in the manufacturing area. |
|
|
x |
|
|
8 |
|
17 |
Standardized production with organized procedures is followed. |
|
x |
|
|
|
||
|
18 |
Improvement methods have been implemented in the manufacturing area. |
|
|
x |
|
|
||
|
19 |
The first three “S” are followed in the manufacturing area. |
|
|
x |
|
|
||
|
20 |
A long-term improvement plan is in place in the manufacturing area. |
|
x |
|
|
|
||
|
Sustain |
21 |
Workers adhere to the established working hours. |
|
|
|
x |
|
9 |
|
22 |
Procedures and standards are known to all in the manufacturing area. |
|
|
x |
|
|
||
|
23 |
A training program is in place in the manufacturing area. |
|
x |
|
|
|
||
|
24 |
Wrokers effectively perform their tasks. |
|
|
x |
|
|
||
|
25 |
Workers have an accurate understanding of the impact of applying the 5S methodology. |
|
x |
|
|
|
||
|
|
|
TOTAL SCORE |
43/100 |
|||||
Source: Prepared by the authors.
Figure 4 shows the contrast between the predicted and actual scores in each phase of the 5S after the initial assessment of their level of adoption in the company.
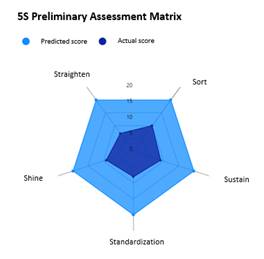
Figure 4. Level of adoption of 5S in the preliminary assessment.
Source: Prepared by the authors.
Table 3. Production Efficiency Results in August.
|
Dimension: Efficiency |
Period: 2021 |
||
|
|
|||
|
Week |
Used Time |
Target Time |
Weekly Efficiency (%) |
|
1 |
43.92 h |
50 h |
87.84% |
|
2 |
43.28 h |
50 h |
86.56% |
|
3 |
43.39 h |
50 h |
86.78% |
|
4 |
43.82 h |
50 h |
87.64% |
|
Weekly Efficiency (%) |
87.21% |
||
Source: Prepared by the authors.
Table 4. Production Effectiveness Results in August.
|
Dimension: Effectiveness |
Period: 2021 |
||
|
|
|||
|
Week |
Garment Pieces Produced |
Production Target |
Weekly Effectiveness (%) |
|
1 |
303 |
350 |
86.57% |
|
2 |
314 |
350 |
89.71% |
|
3 |
297 |
350 |
84.86% |
|
4 |
310 |
350 |
88.57% |
|
Weekly Effectiveness (%) |
87.43% |
||
Source: Prepared by the authors.
Table 5 shows that the productivity rate for August was 1.3740, resulting in a profit of 0.3740 monetary units for each unit invested.
Table 5. Production Productivity Calculation in August.
|
Dimension: Productivity |
Period: 2021 |
|||||
|
Used Raw Material |
RM Unit Cost |
No. of Operators |
Working Hours |
Hourly Labor Cost |
Other expenses |
|
|
918 m. |
S/ 16.00 |
2 |
200 h |
S/ 4.65 |
S/ 378.00 |
|
|
|
||||||
|
PRODUCTIVITY |
1.3740 |
|||||
Source: Prepared by the authors.
Implementation of the 5S in the Production Department
Seiri (sort)
Table 6 records a total of 487 items, some of which were correctly located, while others were not. Out of this group, 100 items were deemed “nonessential”. Thirty-six of these nonessential items will be eliminated, and 64 will be moved out of the Production Department.
Table 6. Implementation of the First “S”(Seiri) in the Production Department.
|
Item |
Description |
Quantity |
Essential? |
Type |
Relocate |
Discard |
|
1 |
Serger thread |
73 |
Essential |
MI |
|
|
|
2 |
Needle thread |
152 |
Essential |
MI |
|
|
|
3 |
Scissors |
5 |
Essential |
MI |
|
|
|
… |
… |
… |
… |
… |
… |
… |
|
43 |
Phone |
1 |
Essential |
T |
|
|
|
44 |
Rib bags |
36 |
Nonessential |
ME |
36 |
|
|
45 |
Thread nipper |
2 |
Essential |
MI |
|
|
|
TOTAL |
487 |
|
|
64 |
36 |
|
Source: Prepared by the authors.
Moreover, compliance with Seiri (sort) was evaluated, and it was found that nonessential items in the production department accounted for 20.53% of the total.
![]()
Seiton (straighten)
The most frequently used materials and tools make up 75.61% of the items used daily and weekly, as shown in Table 7.
Table 7. Implementation of the Second “S”(Seiton) in the Production Department.
|
Item |
Description |
Frequency of Use |
||||
|
Daily |
Weekly |
Monthly |
Quarterly |
Annual |
||
|
1 |
Serger thread |
X |
|
|
|
|
|
2 |
Needle thread |
X |
|
|
|
|
|
3 |
Duct tape |
|
X |
|
|
|
|
… |
… |
… |
… |
… |
… |
… |
|
43 |
Screwdriver |
|
X |
|
|
|
|
44 |
Overlock |
X |
|
|
|
|
|
45 |
Needles |
X |
|
|
|
|
|
TOTAL |
20 |
11 |
4 |
2 |
4 |
|
|
% Frequency |
48.78% |
26.83% |
9.76% |
4.88% |
9.76% |
|
Source: Prepared by the authors.
Seiso (shine)
An assessment of the production sub-areas according to their level of hygiene is shown in Table 8. Out of the total sub-areas evaluated, 33.3% were clean, 16.7% were not very clean, and 50% were very dirty. Additionally, it was found that 77.1% of the proposed cleaning program was followed.
Table 8. Implementation of the Third “S”(Seiso) in the Production Department.
|
Item |
Production Subareas |
Current State |
|||
|
Clean |
Not Very Clean |
Very Dirty |
|||
|
1 |
Thread Subareas |
|
|
X |
|
|
2 |
Machines in General Subareas |
|
|
X |
|
|
3 |
Sublimation Subareas |
X |
|
|
|
|
4 |
Tape Placement Subarea |
X |
|
|
|
|
5 |
Cutting Subarea |
|
|
X |
|
|
6 |
Cutting Table Subarea |
|
X |
|
|
|
TOTAL |
33.3% |
16.7% |
50% |
||
|
Summary of Cleaning Program Compliance |
|||||
|
Month |
Executed Cleansing Activities |
Planned Cleansing Activities |
|||
|
August |
6 |
12 |
|||
|
September |
9 |
12 |
|||
|
October |
10 |
12 |
|||
|
November |
12 |
12 |
|||
|
Total |
37 |
48 |
|||
|
Percentage (%) |
77.1% |
100% |
|||
Source: Prepared by the authors.
Seiketsu (standardization)
Table 9 shows that an average of 88.75% of the workplace standards and guidelines were implemented, indicating significant progress in the standardization program for maintaining organization and hygiene.
Table 9. Implementation of the Fourth“S”(Seiketsu) in the Production Department.
|
Item |
Description |
Score |
Total |
|||
|
25% |
50% |
75% |
100% |
|||
|
1 |
Documenting procedures |
|
|
x |
|
85% |
|
2 |
Set quality standards |
|
|
x |
|
85% |
|
3 |
Education and training |
|
|
|
x |
100% |
|
4 |
Monitoring and measuring |
|
|
x |
|
85% |
|
|
AVERAGE PERCENT |
88.75% |
||||
Source: Prepared by the authors.
Shitsuke (sustain)
Table 10 highlights that the execution of the continuous improvement program had an average of 96.25%, which reflects the company’s commitment to improving the standards of the 5S process.
Table 10. Implementation of the Fifth “S”(Shitsuke) in the Production Department.
|
Item |
Description |
Score |
Total |
|||
|
25% |
50% |
75% |
100% |
|||
|
1 |
Incentives and recognition of achievements |
|
|
|
x |
100% |
|
2 |
Internal audits |
|
|
|
x |
100% |
|
3 |
Continuous assessment and improvement |
|
|
x |
|
85% |
|
4 |
Training and awareness-raising |
|
|
|
x |
100% |
|
|
AVERAGE PERCENT |
96.25% |
||||
Source: Prepared by the authors.
Productivity Assessment After the Implementation of the 5S in the Company
In Table 11, the weekly efficiency showed notable progress, reaching 100.12% in the Production Department’s use of time to optimize the T-shirt manufacturing process.
Table 11. Production Efficiency Results in November.
|
Dimension: Efficiency |
Period: 2021 |
||
|
|
|||
|
Week |
Used Time |
Target Time |
Weekly Efficiency (%) |
|
1 |
39.89 h |
40 h |
100.28% |
|
2 |
39.97 h |
40 h |
100.08% |
|
3 |
39.98 h |
40 h |
100.05% |
|
4 |
40.35 h |
40 h |
99.13% |
|
Weekly Efficiency (%) |
100.12% |
||
Source: Prepared by the authors.
During November, the weekly efficiency in the production of T-shirts reached 108.75%, as detailed in Table 12.
Table 12. Production Effectiveness Results in November.
|
Dimension: Effectiveness |
Period: 2021 |
||
|
|
|||
|
Week |
Garment Pieces Produced |
Production Target |
Weekly Effectiveness (%) |
|
1 |
428 |
400 |
107.00% |
|
2 |
433 |
400 |
108.25% |
|
3 |
434 |
400 |
108.50% |
|
4 |
445 |
400 |
111.25% |
|
Monthly Effectiveness (%) |
108.75% |
||
Source: Prepared by the authors.
Table 13 confirms that productivity remained at 1.5303 during November, generating a profit of 0.5303 monetary units for each unit invested. Furthermore, the “other expenses” category amounted to S/ 0.00 because there was no overtime, as everyone complied with the 8-hour-per-day goal.
Table 13. Production Productivity Calculation in November.
|
Dimension: Productivity |
Period: 2021 |
||||||
|
Used Raw Material |
RM Unit Cost |
No. of Operators |
Working Hours |
Hourly Labor Cost |
Other Expenses |
||
|
1 305 m. |
S/ 16.00 |
2 |
160 h. |
S/ 5.17 |
S/ 0.00 |
||
|
|
|||||||
|
PRODUCTIVITY |
1.5303 |
||||||
Source: Prepared by the authors.
The efficiency, effectiveness, and productivity parameters have shown notable improvements, with increases of 14.8%, 24.4%, and 11.4%, respectively, as shown in Figure 5.
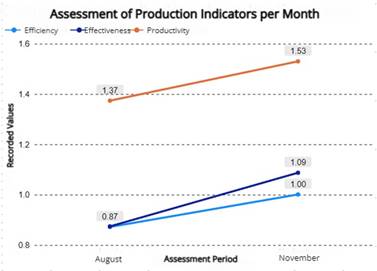
Figure 5. Assessment of production indicators per month.
Source: Prepared by the authors.
The 5S implementation was assessed using a data verification sheet, as shown in Table 14. The results show a compliance level of 87%, which is considered “excellent”.
Table 14. Level of Adoption of the 5S in the Company After the Implementation of Improvements.
|
Stage |
Item |
Evaluation Criteria |
0 |
1 |
2 |
3 |
4 |
Total |
|
Sort |
1 |
There are only essential items, equipment, and tools in the manufacturing area. |
|
|
|
x |
|
18 |
|
2 |
There are only essential equipment and tools in the manufacturing area. |
|
|
|
|
x |
||
|
3 |
There are sufficient raw materials in the manufacturing area. |
|
|
|
|
x |
||
|
4 |
There are cleaning standards in place in the manufacturing area. |
|
|
|
x |
|
||
|
5 |
There is visual control of processes in the manufacturing area. |
|
|
|
|
x |
||
|
Straighten |
6 |
Items are easily accessible in the manufacturing area. |
|
|
|
x |
|
16 |
|
7 |
Machines are properly located in the manufacturing area. |
|
|
|
|
x |
||
|
8 |
There are designated spaces for storing tools in the manufacturing area. |
|
|
|
|
x |
||
|
9 |
Transit ailes in the manufacturing area are clearly marked. |
|
|
x |
|
|
||
|
10 |
The manufacturing area operates at maximum production capacity. |
|
|
|
x |
|
||
|
Shine |
11 |
Transit ailes in the manufacturing area are cleaned and without any waste. |
|
|
|
x |
|
18 |
|
12 |
There are designated personnel responsible for maintaining cleanliness. |
|
|
|
x |
|
||
|
13 |
The machines and equipment in the manufacturing area are kept in good condition. |
|
|
|
|
x |
||
|
14 |
The manufacturing area is cleaned whenever it is needed. |
|
|
|
|
x |
||
|
15 |
There are adequate waste containers in the manufacturing area. |
|
|
|
|
x |
||
|
Standardization |
16 |
There are set rules and procedures in the manufacturing area. |
|
|
|
|
x |
18 |
|
17 |
Standardized production with organized procedures is followed. |
|
|
|
x |
|
||
|
18 |
Improvement methods have been implemented in the manufacturing area. |
|
|
|
x |
|
||
|
19 |
The first three “S” are followed in the manufacturing area. |
|
|
|
|
x |
||
|
20 |
A long-term improvement plan is in place in the manufacturing area. |
|
|
|
|
x |
||
|
Sustain |
21 |
Workers adhere to the established working hours. |
|
|
|
x |
|
17 |
|
22 |
Procedures and standards are known to all in the manufacturing area. |
|
|
|
x |
|
||
|
23 |
A training program is in place in the manufacturing area. |
|
|
|
|
x |
||
|
24 |
Wrokers effectively perform their tasks. |
|
|
|
x |
|
||
|
25 |
Workers have an accurate understanding of the impact of applying the 5S methodology. |
|
|
|
|
x |
||
|
|
|
TOTAL SCORE |
87/100 |
|||||
Source: Prepared by the authors.
The difference between the predicted score and the actual score in each 5S phase after the final assessment of the degree of implementation of these steps is illustrated in Figure 6.
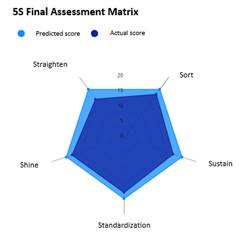
Figure 6. Level of adoption of 5S in the final assessment.
Source: Prepared by the authors.
Hypothesis Testing
In this study, we investigated whether implementing 5S positively impacts labor productivity in a garment manufacturing company. To determine this, the following hypotheses were formulated:
Ho = There is no significant difference in labor productivity before and after implementing 5S.
Ha = There is no significant difference in labor productivity before and after implementing 5S
The data was analyzed using the Anderson-Darling test in MINITAB 19, which confirmed normality (p > 0.05). Figures 7 and 8 were then created to compare productivity before and after the implementation of 5S in the company.
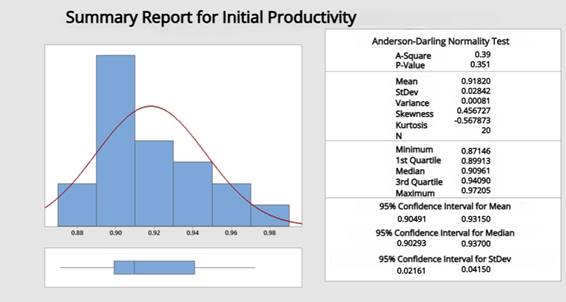
Figure 7. Anderson-Darling normality test for productivity before the implementation of the 5S methodology.
Source: Prepared by the authors.
Figure 8. Anderson-Darling normality test for productivity after the implementation of the 5S methodology.
Source: Prepared by the authors.
After confirming that the data was parametrically distributed, the Student’s t-test was used to compare two samples and evaluate the hypotheses. The resulting p-value was 0.000, less than the significance level of 0.05. Therefore, the null hypothesis (Ho) was rejected and the alternative hypothesis (Ha) was accepted, suggesting that implementing 5S does increase garment manufacturing productivity.
DISCUSSION
In a similar study by Rojasra and Qureshi (2013), the 5S methodology was applied to a small company to improve its processes. Non-value-adding sub-processes were identified and eliminated at each stage of the industrial operation, resulting in an overall increase in production efficiency from 67% to 88.8% in just one week.
According to Gupta and Jain (2015), the implementation of the 5S methodology had a positive impact on a company that produces scientific equipment. They found a significant reduction in the time needed to find tools during the manufacturing process, from 30 minutes to just 5 minutes in a span of 20 weeks. Similarly, Gupta and Chandna (2020) also implemented the same approach in another company that produced scientific equipment, and after 24 weeks, their audit score increased from 6 to 72.
Meanwhile, Vargas and Camero (2022) conducted an initial analysis of 5S to prepare for implementing lean manufacturing. They recorded an initial average value of 2.8. After completing the 5S implementation and conducting an audit, they observed an increase in the average value, which reached 4.03. This increase was due to a decrease in time wasted searching for materials and moving personnel, as well as improvements in organization and cleanliness in the Production Department.
Based on these studies, it can be concluded that 5S is an effective tool to distinguish between activities that generate value and those that do not, enhance work efficiency, and increase worker engagement in various work contexts.
CONCLUSIONS
In August, the weekly efficiency and T-shirt production efficiency were recorded at 87.21% and 87.43% respectively. However, after implementing the 5S methodology in November, these values improved substantially. The weekly efficiency improved to 100.12%, while the weekly T-shirt production efficiency increased to 108.75%. This represented an increase of 14.8% and 24.4% in both indicators, respectively.
During the initial assessment conducted in August, productivity was found to be at 1.3740. This means that for each monetary unit invested, an additional profit of 0.3740 monetary units was generated. However, after implementing the 5S methodology, the productivity remained high in November at 1.5303. This indicates that for each unit of currency invested, an additional benefit of 0.5303 monetary units was generated. This shows an increase of 11.4% in this indicator.
A final assessment of the 5S state was conducted using a data verification form, which showed a marked improvement in the adoption of 5S in the company. This improvement is reflected in an increase in the rating level from 43% initially categorized as “requires improvement”, to 87%, which is now considered “excellent”.
REFERENCE
[1] Abu, F., Gholami, H., Mat Saman, M. Z., Zakuan, N., & Streimikiene, D. (2019). The implementation of lean manufacturing in the furniture industry: A review and analysis on the motives, barriers, challenges, and the applications. Journal of Cleaner Production, 234, 660-680. https://doi.org/10.1016/j.jclepro.2019.06.279
[2] Achibat, F. E., Lebkiri, A., Aouane, E. M., Lougraimzi, H., Berrid, N., & Maqboul, A. (2023). Analysis of the impact of Six Sigma and Lean Manufacturing on the Performance of Companies. Management Systems in Production Engineering, 31(2), 191-196. https://doi.org/10.2478/mspe-2023-0020
[3] Chilón Aguilar, X. M., Esquivel Paredes, L., & Estela Tamay, W. (2017). Implementación de las 5s para incrementar la productividad en una planta embotelladora de agua. Ingnosis, 3(1), 130-139. https://doi.org/10.18050/ingnosis.v3i1.2028
[4] Goswami, D., Gupta, R., & Choudhary, B. (2019) An experimental Examination of ‘5S’ Technique for Continuous Improvement of the Manufacturing Process. International Journal of Innovative Technology and Exploring Engineering, 8(11), 3494-3497. https://doi.org/10.35940/ijitee.k2488.0981119
[5] Guzel, D., & Asiabi, A. (2022). Increasing Productivity of Furniture Factory with Lean Manufacturing Techniques (Case Study). Tehnički Glasnik, 16(1), 82-92. https://doi.org/10.31803/tg-20211010121240
[6] Gupta, S., & Jain, S. K. (2015). An application of 5S concept to organize the workplace at a scientific instruments manufacturing company. International Journal of Lean Six Sigma, 6(1), 73-88. https://doi.org/10.1108/ijlss-08-2013-0047
[7] Gupta, S., & Chandna, P. (2020). A case study concerning the 5S lean technique in a scientific equipment manufacturing company. Grey Systems: Theory and Application, 10(3), 339-357. https://doi.org/10.1108/gs-01-2020-0004
[8] Hanif, H., Rakhman, A., & Nurkholis, M. (2018). New productivity concept based on local wisdom: Lessons from Indonesia. Journal of Management and Marketing Review, 3(3), 96-103. https://doi.org/10.35609/jmmr.2018.3.3
[9] Hossen, J., Ahmad, N., & Ali, S. M. (2017). An application of Pareto analysis and cause-and-effect diagram (CED) to examine stoppage losses: a textile case from Bangladesh. Journal of the Textile Institute, 108(11), 2013-2020. https://doi.org/10.1080/00405000.2017.1308786
[10] Huánuco, L., & Rosales López, P. P. (2018). Impacto de las 5S en la Calidad Microbiológica del Aire del laboratorio de calidad de productos agrobiológicos. Industrial Data, 21(2), 17-24. https://doi.org/10.15381/idata.v21i2.15599
[11] Jaca, C., Viles, E., Paipa-Galeano, L., Santos, J., & Mateo, R. (2014). Learning 5S principles from Japanese best practitioners: case studies of five manufacturing companies. International Journal of Production Research, 52(15), 4574-4586. https://doi.org/10.1080/00207543.2013.878481
[12] Jiménez, M., Romero, L., Domínguez, M., & Espinosa, M. (2015). 5S methodology implementation in the laboratories of an industrial engineering university school. Safety Science, 78, 163-172. https://doi.org/10.1016/j.ssci.2015.04.022
[13] Makwana, A., & Patange, G. (2022). Strategic implementation of 5S and its effect on productivity of plastic machinery manufacturing company. Australian Journal of Mechanical Engineering, 20(1), 111-120. https://doi.org/10.1080/14484846.2019.1676112
[14] Ministerio de la Producción. (2022). Sector Textil y Confecciones 2020. https://ogeiee.produce.gob.pe/index.php/en/shortcode/oee-documentos-publicaciones/publicaciones-anuales/item/1065-estudio-de-investigacion-sectorial-sector-textil-y-confecciones-2020
[15] Palange, A., & Dhatrak, P. (2021). Lean manufacturing a vital tool to enhance productivity in manufacturing. Materials Today: Proceedings, 46, 729-736. https://doi.org/10.1016/j.matpr.2020.12.193
[16] Randhawa, J. S., & Ahuja, I. (2018). An evaluation of effectiveness of 5S implementation initiatives in an Indian manufacturing enterprise. International Journal of Productivity and Quality Management, 24(1), 101-133. https://doi.org/10.1504/ijpqm.2018.091170
[17] Rojasra, P. M., & Qureshi, M. (2013). Performance Improvement through 5S in Small Scale Industry: A case study. International Journal of Modern Engineering Research (IJMER) 3(3), 1654-1660.
[18] Shahriar, M. M., Parvez, M. S., Islam, M. A., & Talapatra, S. (2022). Implementation of 5S in a plastic bag manufacturing industry: A case study. Cleaner Engineering and Technology, 8. https://doi.org/10.1016/j.clet.2022.100488
[19] Srinivasan, S., Ikuma, L., Shakouri, M., Nahmens, I., & Harvey, C. (2016). 5S impact on safety climate of manufacturing workers. Journal of Manufacturing Technology Management, 27(3), 364-378. https://doi.org/10.1108/jmtm-07-2015-0053
[20] Vargas Crisóstomo, E. L., & Camero Jiménez, J. W. (2022). Aplicación del Lean Manufacturing (5s y Kaizen) para el incremento de la productividad en el área de producción de adhesivos acuosos de una empresa manufacturera. Industrial Data, 24(2), 249-271. https://doi.org/10.15381/idata.v24i2.19485
[21] Veres, C., Marian, L., Moica, S., & Al-Akel, K. (2018). Case study concerning 5S method impact in an automotive company. Procedia Manufacturing, 22, 900-905. https://doi.org/10.1016/j.promfg.2018.03.127
[22] Zadry, H. R., & Darwin, R. (2020). The Success of 5S and PDCA Implementation in Increasing the Productivity of an SME in West Sumatra. IOP Conference Series. Materials Science and Engineering. https://doi.org/10.1088/1757-899x/1003/1/012075