Revista Industrial Data 27(2): 123-152 (2024)
DOI: https://doi.org/10.15381/idata.v27i2.26975
ISSN: 1560-9146 (Impreso) / ISSN: 1810-9993 (Electrónico)
Management Model based on Total Productive Maintenance (TPM) and Six Sigma to increase Overall Equipment Effectiveness (OEE) in a Textile and Apparel Company in Lima, Peru
Production and Management
Submitted: 20/12/2023 Accepted: 28/02/2024 Published: 31/12/2024
DOI https://doi.org/10.15381/idata.v27i2.26975.g20454
Jorge Enrique, Ortiz Porras [1]
Andrei Mikhailo, Bancovich Erquinigo[2]
Harold Smith, Quintana Saavedra[3]
Paola Lisbeth, Crispin Chamorro [4]
Lisseth Margarita, Huayanay Palma[5]
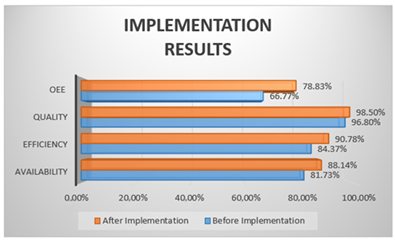
This article addresses the challenge of low overall equipment effectiveness (OEE) within the textile industry. It identifies the need to enhance equipment availability, quality, and performance to tackle sectoral challenges. The main objective of this research study aimed to develop and implement a management model based on total productive maintenance (TPM) and Six Sigma, using a textile company as a case study. A sample of 28 machines from the Weaving Department was taken and various tools were applied, including internal analysis, process flow diagram (PFD), failure mode and effects analysis (FMEA), Pareto analysis, cause-and-effect matrix, 5S, TPM, I-MR charts, and control plans. As a result, a remarkable increase of 9.09% in OEE was achieved, demonstrating specific improvements of 5.18% in equipment availability, 4.23% in performance, and 1.6% in quality.
Keywords: textile industry, Six Sigma, total productive maintenance, overall equipment efficiency.
The textile industry pioneered the transformation brought about by the Industrial Revolution, significantly contributing to the development of many world economies and exerting considerable political influence over an extended period (Scheffer, 2012). Notably, the textile industry is characterized by being highly globalized within the industrial landscape (Lee et al., 2011). As such, it is a crucial sector for both industrialized and less-developed economies, serving as a key driver of wealth and employment generation. For instance, in Europe, it employs more than two million people (Slović et al., 2016), while in countries such as Bangladesh, the textile industry is the most economically significant and rapidly growing sector (Rahman et al., 2022).
In the Peruvian context, the textile industry holds particular relevance, as it contributes to culture and enriches the country’s identity (Fuentes et al., 2019). It is often viewed as a developed sector equipped with modern, high-tech machinery, which enhances the efficient use of human resources, increases productivity, improves working methods, and reduces production costs. This ultimately makes high-quality products available at lower prices (Salazar, 2020). According to Arroyo and Timaná (2022), the textile industry, particularly in Lima and the well-known textile hub of Gamarra, has played a pivotal role in Peru’s economy over the years, with notable technological advances throughout its history. However, the industry faces significant challenges, most notably regarding lead times, which are hindered by productivity issues in production (Slović et al., 2016). These challenges include limited financial resources, insufficient personnel and time, poor resource utilization, little or no experience, and limited trust in implementing new systems (Tangen, 2005).
Accordingly, the main objective of this research is to develop a model that integrates lean and Six Sigma methodologies, using the 5s and total productive maintenance (TPM) as key tools to increase the overall equipment effectiveness (OEE) within textile companies. A specific company will be used as a case study, primarily engaged in fabric production and the manufacturing of knitted garments, mostly polo shirts and jackets. With over 30 years of experience, it has achieved remarkable development and sustained growth in production volumes. However, its current performance is affected by various forms of waste, which have significantly reduced overall equipment effectiveness (OEE).
This research paper aims to contribute new knowledge to the scientific community by developing a model that integrates the best tools of the Lean Six Sigma framework, specifically tailored to the textile industries. Through theoretical and practical validation of this model, we aim to ensure its applicability to other companies within the sector. This model will serve as a guide to enhance the overall equipment effectiveness and pave the way for future research seeking to implement it in similar contexts.
Six Sigma
Six Sigma is a statistical analysis methodology that enables organizations to assess their current operational conditions and improve process performance to reduce variation and maintain quality results. Its primary goals are to minimize defects, increase profits, improve product quality, and enhance customer satisfaction (Mittal et al., 2023). This methodology uses a systematic implementation tool known as DMAIC, which involves defining the problem, measuring, analyzing, improving, and controlling processes (Kumar et al., 2018).
DMAIC
DMAIC, which stands for define, measure, analyze, improve, and control, is an implementation methodology based on data analysis used to optimize procedures. It employs a quality improvement framework tailored to the specific needs of an organization or project (Hannafin et al., 2023). In the DMAIC implementation phases, the “define” phase involves identifying improvement projects. The “measure” phase involves collecting data, performing statistical analyses, and establishing success indicators for the process in question. During the “analyze” phase, the gathered data are processed to determine the root causes of any process malfunctions. During the “improve” phase, effective solutions are implemented to address the identified problem. Finally, the “control” phase involves developing a control plan to ensure the improvements achieve the desired outcomes and are sustained over time (Garza et al., 2016).
5S
5S is a lean management tool designed to eliminate non-value-added processes in manufacturing industries, ensuring the standardization and organization of methods and processes (Andrés-López et al., 2015). Implementing this tool contributes to improving production efficiency and positively impacts workplace safety. A well-organized environment encourages employees to work more effectively (Senthil et al., 2022).
Total Productive Maintenance (TPM)
Total Productive Maintenance (TPM) is a comprehensive strategy involving employees’ active participation in continuous operation and maintenance activities (Au-Yong et al., 2022). This approach focuses on enhancing equipment effectiveness through preventive maintenance to eliminate disruptions such as breakdowns, accidents, and defects within the production system while reducing associated costs (Mushtopa et al., 2023).
Overall Equipment Effectiveness (OEE)
Overall equipment effectiveness (OEE) is a crucial metric for assessing sustainability improvement in a company’s processes compared to their initial state (Haddad et al., 2021). In addition to assessing the performance of machines and systems, OEE also provides valuable insights into the performance of personnel responsible for system maintenance (Sibarani et al., 2021).
TPM and Six Sigma Model in the Textile Industry
The model designed in this research study integrates the TPM tool with Six Sigma to enhance overall equipment effectiveness in a textile company. The model is illustrated in Figure 1.
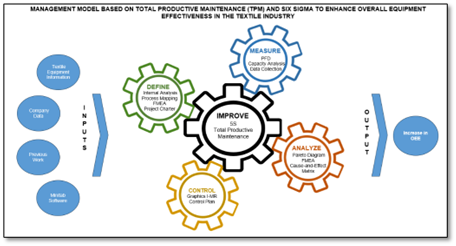
Figure 1. Management model based on TPM and Six Sigma Model to enhance OEE in the textile industry.
Source: Prepared by the authors
The research was conducted through a case study approach. This article demonstrates how implementing the developed model increases the overall equipment effectiveness in a textile company. The case study methodology was chosen due to its versatility in design and its flexibility in using both quantitative and qualitative analyses tailored to the needs and context of the company (Sánchez et al., 2020). Furthermore, this approach facilitates data collection through direct observation in established operating environments, allowing for a comparative analysis of the collected data (Sunder et al., 2019).
The research population was comprised of 30 pieces of equipment from the company’s Weaving Department. Using probabilistic sampling with a confidence level of 95% and a margin of error of 5%, the sample was determined to include 28 equipment pieces. The primary data collection techniques were direct observation and documentary review, employing instruments such as data recording forms tailored for each variable and a documentary analysis guide designed to assess the current context of the company.
Data was collected over three months, spanning the first and second quarters of 2023. This time frame allowed for comparing the state of operations before and after implementing the TPM and Six Sigma model. In the initial phase, data were collected, a comprehensive mapping of all company processes was conducted, and an evaluation of process capability and sigma levels was performed to understand its operations thoroughly.
Define Phase
The company under study operates in the textile and apparel sector and has more than 30 years of experience, successfully positioning itself in the market. Its main economic activity is the production of garments for export, with vertical integration as its main competitive advantage.
A macro-process mapping was created to understand how the interconnected parts of the company operate and how various functions and activities are related (Figure 2.a). Additionally, an internal analysis of the company was completed by identifying the value chain. This helped to understand how value is created, pinpoint areas for improvement, and illustrate how the processes within the production macro-process can be optimized, which is the focus of this study (Figure 2.b).
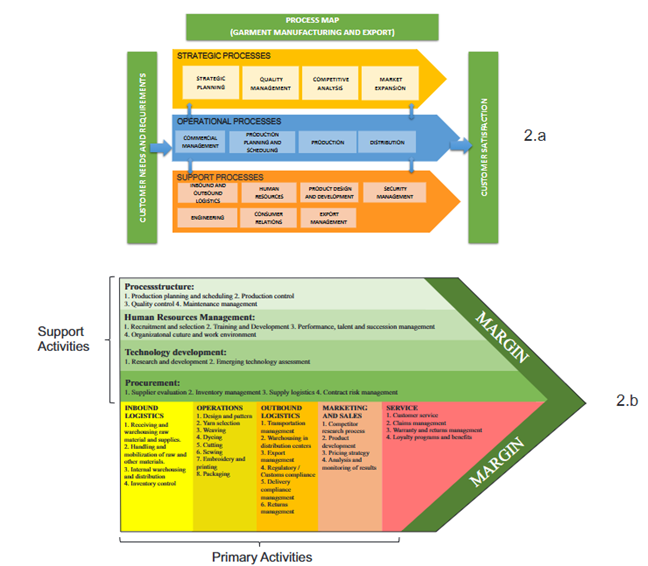
Figure 2. Internal analysis of the company.
Source: Prepared by the authors.
Following the internal analysis, a failure mode and effect analysis (FMEA) was conducted to determine which production process should be the focus of the study. The results are summarized in Table 1.
Table 1. FMEA of Production Processes.
PROCESS |
T-Shirt Manufacturing |
||||||
Process |
Subprocess Description |
Failure Mode |
Effect |
S |
O |
D |
RPN |
Design and Pattern |
The T-shirt design is developed either on paper or digitally, along with a pattern guide. |
Faulty pattern due to lack of maintenance |
Delay in the process |
3 |
2 |
2 |
12 |
Inadequate use of design tools |
Delay in the process |
2 |
4 |
4 |
32 |
||
Weaving |
The fabric is produced through the weaving process, where threads are interwoven to form the material. |
Irregular fabric due to lack of maintenance |
Unscheduled downtime/Generation of defects |
7 |
6 |
4 |
168 |
Wear and tear of critical parts |
Unscheduled downtime/Equipment failure |
7 |
5 |
8 |
280 |
||
Misalignment of needles or machine parts |
Generation of defects/Generation of waste |
7 |
8 |
6 |
336 |
||
Dyeing |
Change of fabric color according to specific requirements |
Poor dyeing results due to malfunction of the fixation equipment |
Generation of defects |
8 |
6 |
2 |
96 |
Lack of operator training in calibrating parameters on the fixation equipment |
Generation of defects/Generation of waste |
6 |
5 |
2 |
60 |
||
Cutting |
Using the pattern as a guide, the fabric is cut into the shapes needed for each part of the T-shirt. |
Cutting blade wear |
Generation of defects |
6 |
7 |
4 |
168 |
Irregular cutting due to lack of maintenance |
Unscheduled downtime/Equipment failure |
7 |
6 |
4 |
168 |
||
Sewing |
The cut pieces of fabric are sewn together to assemble the T-shirt. |
Wear and tear of sewing tools |
Generation of defects |
8 |
6 |
2 |
96 |
Printing or Embroidery |
If necessary, printing or embroidery can be applied. |
Poor machine calibration |
Generation of defects/Generation of waste |
7 |
4 |
6 |
168 |
Poor quality supplies |
Generation of defects |
6 |
5 |
4 |
120 |
Source: Prepared by the authors.
As shown in Table 1, the failure modes associated with the weaving process resulted in a higher risk priority number (RPN), leading to the decision to focus on this department. After completing the preliminary phase, the project was officially initiated with an incorporation act that defined, among other things, the problems, objectives, and scope of the project.
Measure Phase
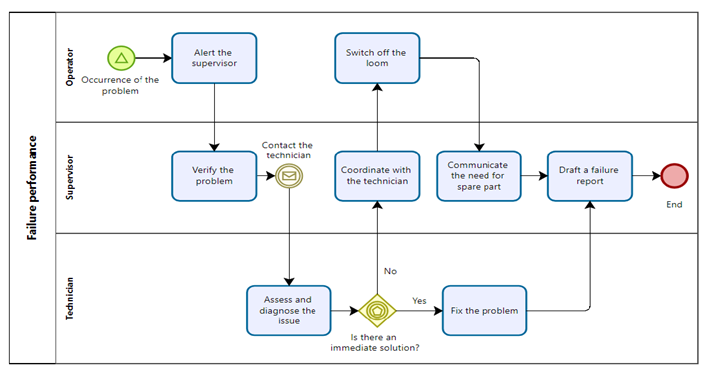
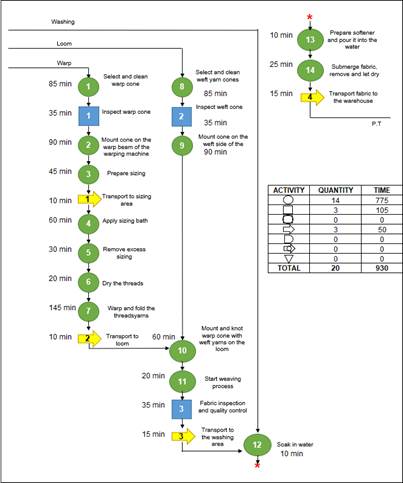
This phase began with the creation of a process flow diagram (PFD) to detail and visualize the weaving process in the textile company, aiming to understand and optimize this complex manufacturing process. Given the intricate nature of weaving—from yarn selection to quality control of the finished product—a clear and systematic representation of the operations involved was necessary. The PFD allowed each phase to be broken down into individual steps, allowing for the identification of potential inefficiencies, bottlenecks, and opportunities for improvement throughout the process, as illustrated in Figure 3.
.
Figure 3. Process flow diagram of the weaving process.
Source: Prepared by the authors.
Subsequently, data was collected on the current process capability, performance, quality, and availability of the 28 pieces of equipment in the area over a three-month period. The mean values are displayed in Tables 2 and 3.
Table 2. Current Capacity of the Weaving Process.
|
Short-Term Capacity |
Long-Term Capacity |
Sigma Level |
Week 01 |
0.27 |
0.28 |
0.17 |
Week 02 |
0.26 |
0.27 |
0.1 |
Week 03 |
0.25 |
0.27 |
0.11 |
Week 04 |
0.26 |
0.28 |
0.16 |
Mean |
0.26 |
0.275 |
0.135 |
Source: Prepared by the authors.
Table 3. Weaving Department Equipment: Availability, Performance, and Quality.
Equipment |
Availability |
Performance |
Quality |
Equipment |
Availability |
Performance |
Quality |
1 |
85.83% |
86.20% |
96.01% |
15 |
83.33% |
84.27% |
96.17% |
2 |
87.50% |
88.26% |
96.37% |
16 |
82.50% |
83.82% |
96.07% |
3 |
75.00% |
83.73% |
96.18% |
17 |
77.08% |
83.72% |
96.63% |
4 |
68.75% |
73.57% |
95.98% |
18 |
80.00% |
83.37% |
96.00% |
5 |
90.00% |
89.83% |
96.42% |
19 |
74.17% |
83.07% |
96.33% |
6 |
88.33% |
88.14% |
96.02% |
20 |
85.42% |
88.06% |
96.12% |
7 |
75.00% |
85.05% |
96.54% |
21 |
85.00% |
87.40% |
96.36% |
8 |
82.92% |
84.14% |
96.27% |
22 |
83.33% |
86.80% |
95.68% |
9 |
83.33% |
83.77% |
96.03% |
23 |
87.08% |
88.73% |
95.83% |
10 |
84.58% |
84.27% |
96.05% |
24 |
88.75% |
88.48% |
96.36% |
11 |
62.50% |
70.99% |
94.88% |
25 |
87.08% |
88.77% |
95.98% |
12 |
85.00% |
84.22% |
96.00% |
26 |
79.17% |
84.07% |
96.32% |
13 |
74.17% |
82.98% |
95.99% |
27 |
82.92% |
86.04% |
95.95% |
14 |
74.58% |
83.55% |
96.22% |
28 |
81.25% |
85.10% |
95.80% |
Source: Prepared by the authors.
Finally, the overall equipment effectiveness was calculated by multiplying availability, performance, and quality. The results are found in Table 4.
Table 4. Overall Effectiveness of the Weaving Process Equipment.
Equipment |
OEE |
Equipment |
OEE |
Equipment |
OEE |
Equipment |
OEE |
1 |
71.03% |
8 |
67.17% |
15 |
67.53% |
22 |
69.21% |
2 |
74.42% |
9 |
67.04% |
16 |
66.43% |
23 |
74.05% |
3 |
60.40% |
10 |
68.46% |
17 |
62.36% |
24 |
75.67% |
4 |
48.54% |
11 |
42.10% |
18 |
64.03% |
25 |
74.19% |
5 |
77.95% |
12 |
68.72% |
19 |
59.35% |
26 |
64.10% |
6 |
74.76% |
13 |
59.08% |
20 |
72.30% |
27 |
68.45% |
7 |
61.58% |
14 |
59.96% |
21 |
71.59% |
28 |
66.24% |
Source: Prepared by the authors.
Analyze Phase
A Pareto Diagram was developed during this phase to identify key problems, prioritize actions, and focus on root causes, as shown in Figure 4.
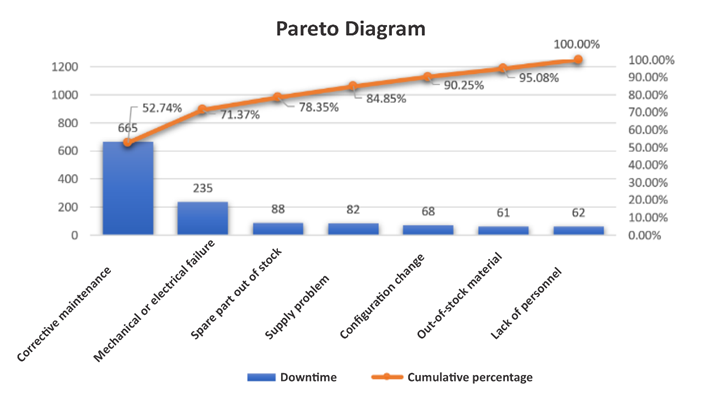
Figure 4. Pareto Diagram.
Source: Prepared by the authors.
Figure 4 illustrates that 80% of the downtime is attributed to issues related to corrective maintenance, mechanical or electrical failure, and out-of-stock spare parts. Since corrective maintenance often arises from equipment failures, addressing these failures directly could significantly reduce downtime. Therefore, the next step was to find the main causes of electrical and mechanical failures. An FMEA was conducted for this purpose, as shown in Table 5.
Table 5. FMEA in the Weaving Process.
Problem |
Problem Description |
Failure Mode |
Effect |
S |
O |
D |
RPN |
Fabric and Weft Problems |
Problems related to the integrity and arrangement of warp and weft yarns can affect the uniformity and overall structure of the fabric. |
Variation in the edge of the fabric |
Deformation of the final product that leads to issues with adjustment in subsequent processes |
6 |
7 |
8 |
336 |
Threads protruding at the edges |
Poor appearance and strength of the product that also causes problems in the subsequent stage |
7 |
6 |
4 |
168 |
||
Short wefts missing on the entry or take-up side |
Discontinuities in the fabric that affect its uniformity |
6 |
5 |
5 |
150 |
||
Lighter areas on the fabric in the weft direction |
Weaknesses and variations in the fabric that reduce its quality |
6 |
9 |
5 |
270 |
||
Overlapping and alternating of the weft yarn |
Incorrect pattern and irregular weave structure |
5 |
4 |
4 |
80 |
||
Yarn Breakage and Defects |
Problems related to frequent yarn breakage and loose ends can compromise fabric quality and lead to interruptions in production. |
Loose ends of yarn at the edges and bottom |
Tangling in machinery that leads to quality reduction |
6 |
5 |
3 |
90 |
Frequent stoppages due to lack of weft |
Production delays |
7 |
9 |
3 |
189 |
||
Frequent yarn breakage at the edges |
Defective products and loss of material |
7 |
7 |
3 |
147 |
||
Frequent yarn breakage on the front side |
Interruptions in the process |
7 |
7 |
3 |
168 |
||
Frequent yarn stoppages in the harness assembly and at the rear of the shed |
Delays and issues in quality fabric production |
7 |
5 |
3 |
105 |
||
Loom Structure |
Problems related to the physical structure of the loom and how this affects the shape and homogeneity of the fabric. |
Torn fabric |
Destruction of fabric being woven |
9 |
8 |
5 |
360 |
Fabric detachment from the supports |
Generation of unusable products and delays |
7 |
5 |
4 |
140 |
||
Visible support marks |
Poor appearance and quality of the fabric |
6 |
8 |
3 |
144 |
||
Excessively wide edges |
Products out of specification |
6 |
5 |
2 |
60 |
||
Weft insertion defect during transferring |
Issues with the pattern and structure of the fabric |
6 |
5 |
2 |
60 |
||
Mechanisms and Components of the Loom |
Problems related to the internal mechanisms of the loom, including components that may influence the proper operation of the equipment. |
Threads protruding at the edges of the take-up mechanism |
Tangling and damage to machinery |
7 |
7 |
3 |
147 |
The shuttle system does not stop the machine |
Operator safety risks and potential damage to machinery |
9 |
7 |
4 |
252 |
||
The machine stops for no apparent reason |
Delays in production and loss of efficiency |
7 |
7 |
2 |
98 |
Source: Prepared by the authors.
Thus, the main problems were identified and summarized in Table 6 based on the RPN score assigned.
Table 6. Main Problems in the Weaving Department.
Code |
Problem |
RPN |
P1 |
Torn fabric |
360 |
P2 |
Variation in the edge of the fabric |
336 |
P3 |
Lighter areas on the fabric in the weft direction |
270 |
P4 |
The shuttle system does not stop the machine |
252 |
P5 |
Frequent stoppages due to lack of weft |
189 |
P6 |
Threads protruding at the edges |
168 |
P7 |
Frequent yarn breakage at the front of the loom during the shed formation process |
168 |
P8 |
Short wefts missing on the entry or take-up side |
150 |
P9 |
Frequent yarn breakage at the edges |
147 |
Source: Prepared by the authors.
Subsequently, a causality matrix was created to identify causes and subcauses contributing to these problems. The resulting matrix is displayed in Table 7.
Table 7. Matrix of Causes and Subcauses.
Causes |
Main Problems |
||||||||||
P1 |
P2 |
P3 |
P4 |
P5 |
P6 |
P7 |
P8 |
P9 |
|||
Cause |
Roller blockage |
Excessively high warp tensions |
Insufficient braking of the weft yarn |
The machine brake force is insufficient. |
The warping take-up gear has play. |
The compression force is insufficient. |
The projectile gripper has inadequate tension. |
The selvage gripper has accumulated dirt. |
The shed exhibits insufficient dimensions. |
Lubricant residue in the selvage mechanism |
The binding threads are improperly placed. |
Subcause 1 |
Excessive pressure on the fabric edge |
Unwinding speed is too slow |
The feeler blades apply insufficient pressure. |
The machine brake is contaminated with oil. |
The bolt and nut fail to secure the pinion gear effectively. |
The pressure regulator does not operate effectively. |
The projectile firing mechanism housing shows signs of obvious wear |
The lint suction hose does not receive airflow. |
The housing of the opener mechanism shows signs of wear. |
The regulating valve is defective. |
The rethreading box tuck-in box does not secure the incoming thread properly. |
Subcause 2 |
The edge of the fabric is curling up. |
Worn loom sprockets |
Accumulation of tangled weft lint on the feeler blades |
Oil leak |
The nut is missing a washer. |
The electronic component is damaged. |
The system is experiencing excessive resistance. |
The suction motor is not operational. |
The system is experiencing excessive resistance. |
Lack of electrical power for activation |
There is excessive friction in the rethreading box. |
Subcause 3 |
Selvage supply is tangled with lint |
Lack of lubrication in the transmission system |
Contaminated feeler blades |
Excess oil in the storage system |
The threads are worn due to spilled oil. |
The electrical connection between the pins is not established. |
The mechanism lacks proper adjustment. |
The electrical switch does not activate. |
The harness selection mechanism housing lacks lubrication. |
Circuit fuses have blown due to overload. |
The rethreading box lacks lubrication. |
Subcause 4 |
Insufficient cleaning of the supply |
A lubrication system needs to be implemented. |
Lack of cleaning |
Inadequate monitoring of oil level |
Failure to perform a complete and thorough inspection of oil levels |
Welding of the pins to the circuit boards is required. |
A maintenance system needs to be implemented. |
Circuit fuses have blown due to overload. |
A grease and lubrication system needs to be implemented. |
The valve is incorrectly grounded. |
A grease and lubrication system needs to be implemented. |
Source: Prepared by the authors.
Improve Phase
After completing the analysis phase, it became evident that many of the problems stem from a lack of supervision and maintenance, negatively impacting all equipment. Therefore, the company’s existing maintenance procedure was mapped to propose and implement improvements, as illustrated in Figure 5.
Figure 5. Failure Procedure.
Source: Prepared by the authors.
As can be seen in Figure 5, the company has a very inefficient procedure for handling failures. Although maintenance is performed, it is exclusively corrective. This reactive strategy leads to an increase in unexpected failures, resulting in unplanned downtime, additional costs, urgent repairs, and a decline in overall equipment effectiveness.
To address this issue, we proposed implementing the total productive maintenance (TPM) methodology in conjunction with the 5S. This recommendation is based on the synergy between TPM and 5S, two continuous improvement methodologies with a comprehensive approach to enhance efficiency and quality within the operational environment. TPM focuses on maximizing equipment reliability through preventive maintenance and employee involvement, while 5S promotes organization, cleanliness, and standardization of the workplace. This convergence strengthens the identification and proactive resolution of problems, ensures the sustainability of improvements, and fosters team commitment, thereby establishing a solid foundation for operational excellence in the industry.
Implementation of the 5S
In the sorting stage (seiri), a meeting was held with the workers in the Weaving Department to explain to them the tasks involved in this activity. The flow chart shown in Figure 6 was used for this purpose.
Figure 6. Sorting Process.
Source: Prepared by the authors.
The sorting process was implemented under the joint supervision of the production manager and the department manager. During this process, unnecessary objects were labeled with a red tag. This practice not only sped up the work but also encouraged the active participation of the workers in the area.
By the end of the red tag sorting process, 132 objects did not add value to production. Of these, 39 were eliminated, 75 were relocated, and 18 were assessed for repair.
Following this, in the set-in-order stage (seiton), the next step was organizing the essential elements efficiently, enabling operators to locate, use, and replenish them more effectively. The items were selected and arranged based on specific criteria.
After completing the first “S”, a motivational effect is expected to emerge in the Weaving Department, fostering active participation among employees and their commitment to change. This commitment is crucial for the execution of this stage, especially considering the large number of elements involved. Consequently, frequently used items were arranged following the established guidelines. Labels, signage, and signs were used to designate specific areas, making it easier to identify the required items. In addition, items needed at all times were arranged on work tables located around the operators, paying special attention to the equipment technician. This setup allowed the technician to quickly visualize the spare parts and tools necessary to deal with breakdowns, and to verify the availability of spare parts in stock.
In the third stage, shine or seiso, the main objective is to eradicate dirt from the work area, which is a primary cause of failures; dirt makes it difficult to detect abnormal situations and accelerates the deterioration of components (Madariaga, 2013). The fundamentals of this stage were established during a brief meeting, which included the following key points:
1. Focus on identifying and eliminating sources of dirt, such as leaks and waste generators.
2. Control and prevent the spread of dirt by using oil containers to prevent spills and plastic screens to prevent the yarn from falling to the ground.
3. Implement measures to prevent dirt from entering hard-to-clean areas.
4. Properly manage waste generated during activities involving office materials.
5. Replace damaged or broken items.
To facilitate this process, the operators in the Weaving Department filled out improvement opportunity cards designed to detect and record any instances of soiling in the area. These cards were also used to track completed and pending cleaning tasks and were subsequently handed over to the Engineering Department.
Furthermore, a cleaning program was implemented for the equipment and areas organized during the seiton stage to promote discipline and maintain cleanliness. In this program, operators are responsible for cleaning their designated areas and exteriors, while technicians are responsible for cleaning the equipment. This approach aimed to reduce the likelihood of breakdowns caused by dirt accumulation.
To monitor the cleaning program, a checklist was created, and will be overseen by the person in charge of the Weaving Department. Their role will be to verify that the scheduled cleaning activities are performed effectively and efficiently.
During the fourth stage, standardization or seiketsu, a periodic review plan was implemented to maintain and preserve the improvements achieved in the sorting phase. This plan ensures that unnecessary items do not accumulate again in the work area, contributing to sustained organization and efficiency in the long run.
The periodic review plan that was implemented was supported by weekly monitoring to ensure the sustainability of the improvements established in the first three stages. Additionally, constant measurements were taken to evaluate progress and compliance, facilitating the control phase. Daily 15-minute meetings were also held to address questions, motivate action, and encourage commitment from all participants in the project. As part of the continuous improvement strategy, biannual training sessions were scheduled to emphasize the importance of the 5S methodology and discuss how to extend the benefits of the project to other areas both inside and outside the company.
Finally, in the last stage, sustain or shitsuke, efforts were focused on ensuring the sustainability of the standards established in the previous phases. To achieve this, periodic audits were conducted, and corrective actions were applied to ensure compliance with the desired sigma level objectives. Limitations in the implementation of 5S often stem from a lack of control, rigor, and consistency on the part of management, as noted by Madariaga (2013).
To promote discipline in the implementation of 5S in the weaving process, audits were established to allow for an in-depth analysis of application status, measurement of progress, and verification of significant improvements in the area. An audit format was designed to evaluate participation and the degree of 5S implementation among those involved.
Following the first audit, a compliance level of 76% was achieved, which demonstrates a significant commitment from the workers toward continuous improvement. However, areas for improvement were identified, including non-compliance issues in the first two stages. It was also noted that a fixed cleaning schedule needed to be established to prevent disorder in the area, and that weekly follow-up should be reinforced.
The significance of the initial implementation of the 5S methodology in this research lies in its role as a fundamental starting point for any company aiming to improve its processes through lean manufacturing. According to Madariaga (2013), before introducing any lean tools, implementing 5S is crucial as these practices provide a solid foundation for building a culture of organization and cleanliness. They also prepare personnel to address problems and opportunities for improvement efficiently and effectively. Once 5S has been successfully implemented, organizations will be fully equipped to introduce and adopt more advanced Lean techniques.
Implementation of TPM
After successfully applying the 5S methodology and establishing a solid foundation, which, although in its initial state, serves as a basis, we decided to move forward with the implementation of TPM. The first and arguably most crucial pillar of TPM is the implementation of an autonomous maintenance program. According to Madariaga (2013), the main purpose of this pillar is to train operators to perform simple yet frequent preventive maintenance tasks, such as cleaning, adjustment, inspection, and lubrication. These tasks, while small, are essential for the overall success of the implementation. Consequently, the implementation of TPM in this research study centered around the development of cleaning, lubrication, and inspection procedures and programs.
In the initial stage, a team was formed comprising the project leader, seven operators, four technicians, and the supervisor of the Weaving Department. As an initial task, with the assistance of the technicians, two pilot machines were selected: a J710 and a D4S. These machines were used to train operators on their structure, as well as the procedures for cleaning, adjustment, lubrication, and inspection, along with their overall operation.
Following the initial training, sources of dirt, cleaning points, and broken items were identified. Hence, a deep cleaning program was established, specifically targeting the internal structure of the equipment. Additionally, a weekly lubrication program was introduced to ensure the proper functioning of the machines. An inspection program was also implemented to verify that oil levels are adequate and that the entire electrical system is in optimum condition.
After implementing the 5S and TPM integrated model, favorable results were obtained. Figure 7 illustrates the improvements in performance, quality, and availability variables, which ultimately contributed to an increase in overall equipment effectiveness.
Figure 7. Results after model implementation.
Source: Prepared by the authors.
Control Phase
During the control phase, following the implementation of improvements, data was collected five times a week over a three-week period to evaluate performance and ensure that all metrics remained within control limits. To monitor data stability and plan for potential emergencies, a control plan was developed, which is outlined in Table 8.
Table 8. Control Plan.
Control Plan |
||||||||
Parameter |
Formula |
Limit |
Tools |
Unit |
Sample Size |
Frequency |
Person in Charge |
Action Rules |
Availability Loss |
Increase in downtime due to corrective or unplanned maintenance |
Less than 11 hours per machine per week |
I-MR Chart |
Hours |
4 |
Monthly |
Production Analyst |
5S audit and TPM implementation checklist |
Performance Loss |
Decrease in production volume |
More than 5100 meters of fabric produced per machine per month |
I-MR Chart |
Meters |
8 |
Bimonthly |
Production Analyst |
5S audit and TPM implementation checklist |
Quality Loss |
Increase of defects in fabric production |
Less than 130 meters of fabric wasted due to defects per month |
I-MR Chart |
Meters |
2 |
Weekly |
Production Analyst |
Collecting data, identifying root causes and proposing targeted improvements |
Source: Prepared by the authors.
After obtaining the previously described results, a normality test was conducted to determine whether the collected data followed a normal distribution. For this purpose, Minitab 2019 statistical software and the Shapiro-Wilk test (applicable for sample sizes of less than 50 units) were used to verify the following assumptions:
· If the p-value ≤ α, data do not follow a normal distribution.
· If the p-value > α, data follow a normal distribution.
The analysis yielded a p-value > 0.100. Since this value exceeds the significance level established for this study (0.05), it can be stated that the data exhibit a normal distribution.
Once the distribution of the data was confirmed, the Student’s t-test was conducted to evaluate the acceptance or rejection of the hypotheses proposed:
· H0 = There is no significant difference in OEE improvement after model implementation.
· H1 = There is a significant difference in OEE improvement after model implementation.
The test conducted yielded a p-value of 0.000. Therefore, the null hypothesis (H0) is rejected and the alternative hypothesis (H1) is accepted. There is a significant difference in the improvement of overall equipment effectiveness after the implementation of the model.
Following the implementation of the model that integrates Six Sigma and TPM, the company achieved a remarkable 9.09% increase in OEE. This improvement was driven by significant enhancements in key performance indicators. Specifically, availability increased by 5.18%, performance increased by 4.23%, and quality improved by 1.6%. These results demonstrate that the model successfully met its objective of enhancing overall equipment effectiveness in the textile company. These findings are consistent with previous research conducted in textile companies, such as that by Leon-Ludena et al. (2023), which reported a 30% increase in OEE as a result of implementing TPM in a Peruvian textile SME, attributed to preventive maintenance strategies and daily records. Similarly, Ortiz et al. (2022) observed a 2% increase in availability, while Yashini (2020) noted a 1.77% increase in performance. Additionally, Sakti et al. (2019) documented a 3% improvement in quality as a result of implementing TPM. These consistent findings support the effectiveness of the approach adopted in this research study.
This research addressed the question: How can the overall equipment effectiveness (OEE) in a textile company be increased? The answer seems straightforward: through TPM. However, the textile industry has several intrinsic characteristics that make its implementation challenging. For instance, the fast-paced nature of production in this sector, driven by tight deadlines and intense competition, makes effective time management crucial. The complexity and diversity of equipment in textile processes add another layer of difficulty to the implementation of TPM, as meticulous coordination is required to perform maintenance activities without disrupting operational efficiency. Additionally, variability in demand and product types further complicates the establishment of maintenance routines.
Nevertheless, the literature indicates that applying methodologies such as Lean and Six Sigma in the textile sector can provide strategic approaches to address its complexities. Lean focuses on waste elimination and process optimization, which can enhance operational efficiency and reduce lead times in response to accelerated production and intense competition. Meanwhile, Six Sigma focuses on continuous improvement and variability reduction, helping to mitigate the challenges associated with machine diversity and fluctuating demand.
Therefore, the main objective of this study was to develop and implement a model that integrates lean and Six Sigma methodologies, utilizing 5S and TPM as the primary improvement tools to increase the overall equipment effectiveness (OEE) of the Weaving Department in a textile company. As a result of the implementation, there was a remarkable increase of 9.09% in OEE, 5.18% in availability, 4.23% in performance, and 1.6% in quality.
In conclusion, the results support the feasibility and effectiveness of adopting methodological approaches such as lean and Six Sigma in the textile industry. However, it should be noted that the implementation was conducted within a specific context described in the paper. This research opens the door for future studies to explore the application of the model in other areas of textile production, such as cutting, sewing, assembling, and embroidery. Expanding into these areas could provide greater practical validity to the model, enhancing outcomes and highlighting the relevance of its implementation in various stages of the textile production process.
[1] Andrés-López, E., González-Requena, I., & Sanz-Lobera, A. (2015). Lean Service: Reassessment of Lean Manufacturing for Service Activities. In Procedia Engineering, 132, 23-30. https://doi.org/10.1016/j.proeng.2015.12.463
[2] Arroyo, J., & Timaná, R. (2022). Factors Associated with the Health and Economic Effects of the COVID-19 Pandemic in the Peruvian Textile Sector, 2020-2021. Frontiers in Sociology, 7. https://doi.org/10.3389/fsoc.2022.875998
[3] Au-Yong, C., Azmi, N., & Myeda, N. (2022). Promoting employee participation in operation and maintenance of green office building by adopting the total productive maintenance (TPM) concept. Journal of Cleaner Production, 352. https://doi.org/10.1016/j.jclepro.2022.131608
[4] Fuentes, I., Ccorahua, R., Tinoco, O., León, O., & Ramírez, P. (2019). Draft Genome Sequences of Two Textile Azo Dye-Degrading Shewanella sp. Strains Isolated from a Textile Effluent in Peru. Microbiology Resource Announcements, 8(49). https://doi.org/10.1128/mra.00836-19
[5] Garza Ríos, R. C., González Sánchez, C. N., Rodríguez González, E. L., & Hernández Asco, C. M. (2016). Aplicación de la metodología DMAIC de Seis Sigma con simulación discreta y técnicas multicriterio. Revista de Métodos Cuantitativos Para La Economía y La Empresa, 22(1), 19-35.
[6] Haddad, T., Shaheen, B., & Németh, I. (2021). Improving Overall Equipment Effectiveness (OEE) of Extrusion Machine Using Lean Manufacturing Approach. Manufacturing Technology, 21(1), 56-64. https://doi.org/10.21062/mft.2021.006
[7] Hannafin, C., Ponce, L., Dahiya, N., Utecht, C., DeYoung, D., & Flug, J. (2023). DMAIC Quality Improvement Project to Reduce Specimen-Related Safety Events in Ultrasound. Current Problems in Diagnostic Radiology, 52(6), 469-473. https://doi.org/10.1067/j.cpradiol.2023.06.008
[8] Mushtopa, Harsanto, B., & Yunani, A. (2023). Electric power distribution maintenance model for industrial customers: Total productive maintenance (TPM), reliability-centered maintenance (RCM), and four-discipline execution (4DX) approach. Energy Reports, 10, 3186-3196. https://doi.org/10.1016/j.egyr.2023.09.129
[9] Kumar, V., Verma, P., & Muthukumaar, V. (2018). The Performances of Process Capability Indices in the Six-Sigma Competitiveness Levels. Proceedings of the International Conference on Industrial Engineering and Operations Management, 1945-1951.
[10] Lee, J., Lee, Y., & Ulasewicz, C. (2011). International and Beyond: Reflecting on the Identity of the International Textile and Clothing Association. Clothing and Textiles Research Journal, 29(2), 165-182. https://doi.org/10.1177/0887302X11411707
[11] Leon-Ludena, L. A., Diestra-Medroa, C., & Flores-Perez, A. (2023). Improvement Proposal to Reduce the Total Cycle Time in Production through the Application of SLP, 5S and TPM under a DMAIC Approach in a Peruvian Textile SME. ICIEAEU '23: Proceedings of the 2023 10th International Conference on Industrial Engineering and Applications, 71-77. https://doi.org/10.1145/3587889.3587971
[12] Madariaga, F. (2013). Lean Manufacturing. Exposición adaptada a la fabricación repetitiva de familias de productos mediante procesos discretos. Madrid, Spain: Bubok Publishing S.L.
[13] Mittal, A., Gupta, P., Kumar, V., Owad, A., Mahlawat, S., & Singh, S. (2023). The performance improvement analysis using Six Sigma DMAIC methodology: A case study on Indian manufacturing company. Heliyon, 9(3). https://doi.org/10.1016/j.heliyon.2023.e14625
[14] Ortiz Porras, J., Salas Bacalla, J., Huayanay Palma, L., Manrique Alva, R., & Sobrado Malpartida, E. (2022). Modelo de gestión para la aplicación de herramientas Lean Manufacturing para la mejora de la productividad en una empresa de confección de ropa antiflama de Lima - Perú. Industrial Data, 25(1), 103-135. https://doi.org/10.15381/idata.v25i1.21501
[15] Rahman, M., Mainul, A., Mithun, S., & Taghipour, A. (2022). Sustainable supplier selection in the textile dyeing industry: An integrated multi-criteria decision analytics approach. Resources, Conservation & Recycling Advances, 15. https://doi.org/10.1016/j.rcradv.2022.200117
[16] Sakti, S., Panjaitan, A., Asih, A., & Sopha, B. (2019). A Computerized measurement system of machine performance for a textile industry. In IOP Conference Series: Materials Science and Engineering, 673. https://doi.org/10.1088/1757-899X/673/1/012078
[17] Salazar Marín, L. M. (2020). Las mujeres obreras en la industria textil, Lima Metropolitana: 1968-1975. Desde el Sur, 12(1), 79-96. https://dx.doi.org/10.21142/des-1201-2020-0006
[18] Sánchez Marquez, R., Albarracín Guillem, J. M., Vicens-Salort, E., & Jabaloyes Vivas, J. (2020). A systemic methodology for the reduction of complexity of the balanced scorecard in the manufacturing environment. Cogent Business & Management, 7(1). https://doi.org/10.1080/23311975.2020.1720944
[19] Senthil Kumar, K. M., Akila, K., Arun, K. K., Prabhu, S., & Selvakumar, C. (2022). Implementation of 5S practices in a small scale manufacturing industries. Materials Today: Proceedings, 62, 1913-1916. https://doi.org/10.1016/j.matpr.2022.01.402
[20] Scheffer, M. R. (2012). Trends in textile markets and their implications for textile products and processes. In R. Shishoo (Ed.), The Global Textile and Clothing Industry: Technological Advances and Future Challenges. (pp. 8-28). Elsevier Ltd. https://doi.org/10.1533/9780857095626
[21] Sibarani, P., Sofianti, T. D., & Pratama, A. T. (2021). Improving the Overall Equipment Effectiveness (OEE) of Drum Testing Machine in Laboratory of Tire Manufacturing Using FMEA and PFMEA. Proceedings of The Conference on Management and Engineering in Industry, 3(3), 56-61. https://doi.org/10.33555/cmei.v3i3.84
[22] Slović, D., Tomašević, I., & Radović, M. (2016). Improving Productivity in the Apparel Industry Through Gain Sharing and Continuous Process Improvement: the Case of a Serbian Manufacturer. Fibers and Textiles in Eastern Europe, 24 (2), 15-22. https://doi.org/10.5604/12303666.1168239
[23] Sunder, M., Ganesh, L., & Marathe, R. (2019). Lean Six Sigma in Consumer Banking: An Empirical Inquiry. International Journal of Quality & Reliability Management, 36(8), 1345-1369. https://doi.org/10.1108/IJQRM-01-2019-0012
[24] Tangen, S. (2005). Demystifying productivity and performance. International Journal of Productivity and Performance Management, 54(1), 34–46. https://doi.org/10.1108/17410400510571437
[25] Yashini, J. (2020). An Analysis on Minimization of Product Error (Poka-Yoke) and Excess Work in Progress (TPM & OEE) in Textile Industry. International Journal of Research in Engineering, Science and Management, 3(9), 17-22. https://doi.org/10.47607/ijresm.2020.278
Authors’ contributions
Jorge Enrique Ortiz Porras (first author): Investigation, conceptualization,
supervision, and validation.
Andrei Mijailo Bancovich Erquínigo (co-author): Investigation, software,
supervision, and visualization.
Harold Smith, Quintana Saavedra (co-author): Investigation, methodology, and
writing (original draft).
Paola Lisbeth, Crispin Chamorro (co-author): Investigation, methodology, and
writing (review & editing).
Lisseth Margarita, Huayanay Palma (co-author): Investigation, data curation, and writing (review & editing).
[1] Mechatronics engineer from Universidad Nacional de Ingeniería, PhD in Business Management and PhD in Industrial Engineering, both from Universidad Nacional Mayor de San Marcos (UNMSM). Currently, working as an associate and postgraduate professor at the School of Industrial Engineering of UNMSM (Lima, Peru).
Orcid: http://orcid.org/0000-0002-9605-3670
Corresponding author: jortizp@unmsm.edu.pe
[2] Industrial Engineering student at UNMSM (Lima, Peru).
Orcid: http://orcid.org/0000-0002-9657-0408
E-mail: andrei.bancovich@unmsm.edu.pe
[3] Industrial Engineering student at Pontificia Universidad Católica del Perú (Lima, Peru).
Orcid: http://orcid.org/0000-0001-9672-4887
E-mail: a20206266@pucp.edu.pe
[4] Civil Engineering student at Universidad Peruana de Ciencias Aplicadas (Lima, Peru).
Orcid: http://orcid.org/0000-0001-7085-662X
E-mail: u202118540@upc.edu.pe
[5] Graduated in Textile and Apparel Engineering from UNMSM (Lima, Peru). Currently, working as an independent consultant (Lima, Peru).
Orcid: http://orcid.org/0000-0001-7173-988X
E-mail: lisseth.huayanay@unmsm.edu.pe