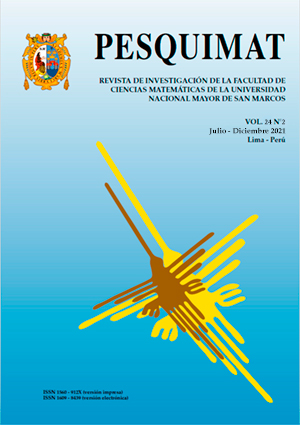
About vector graphics on Latex articles
DOI:
https://doi.org/10.15381/pesquimat.v25i2.24053Keywords:
Inkscape, Python, TikzAbstract
Because the vast majority of scientific articles or papers that we can exchange with researchers use the program LATEXas a word processor main text, the objective of this work is that the reader knows how to generate vector graphics and insert them into his LATEXdocument. To do this, this article lists and demonstrates various techniques and tools that will allow you to achieve this goal. The combined use of programs such as Inkscape, Python and Tikz will show that the results for the graphics are of high quality since there is no loss of resolution when zooming in on the figures. It is known that the graphics in research articles illustrate what is stated in the theoretical aspect helping to transmit complex ideas in a more effective way, because a good and high quality graphic is worth more than a thousand words.
Downloads
Published
Issue
Section
License
Copyright (c) 2022 Teodoro Sulca Paredes, Nancy Moya Lazaro, Gladys Chancan Rojas

This work is licensed under a Creative Commons Attribution-NonCommercial-ShareAlike 4.0 International License.
THE AUTHORS RETAIN THEIR RIGHTS:
a) The authors retain their trademark and patent rights, and also on any process or procedure described in the article.
b) The authors retain the right to share, copy, distribute, execute and publicly communicate the article published in Pesquimat magazine (for example, place it in an institutional repository or publish it in a book), with recognition of its initial publication in the Pesquimat magazine.
c) The authors retain the right to make a later publication of their work, to use the article or any part of it (for example: a compilation of their works, notes for conferences, thesis, or for a book), provided that they indicate the source of publication (authors of the work, magazine, volume, number and date).


